
How to Read Execution List and Execution Detail
Why This Guide
After tests are triggered, most daily troubleshooting happens in two places:
- Execution List page (workspace-level history)
- Execution Detail page (single pipeline execution drill-down)
This guide explains how to read both pages efficiently and move from symptom to root cause faster.
Three Result Levels
Execution data is layered in three levels:
- Trigger Instance: one trigger event (for example, one Manual Trigger run or one Plan schedule hit)
- Pipeline execution: one pipeline run under that trigger instance
- Test case execution: individual test case results inside one pipeline execution
In the UI:
- Execution List top-level row = trigger instance
- Expanded child rows = pipeline executions
- Execution Detail page = test case executions for one pipeline execution
Key identity fields
- Trigger ID: identifies one trigger object/template (for example
P-WKS-7351,G-WKS-0605,M-WKS-00001). - Trigger Instance ID: identifies one concrete run under the same Trigger ID (for example
00007). - Trigger instance key:
trigger id + trigger instance id, uniquely identifies one trigger instance (for exampleM-WKS-00001-00007).
Read the Execution List Page
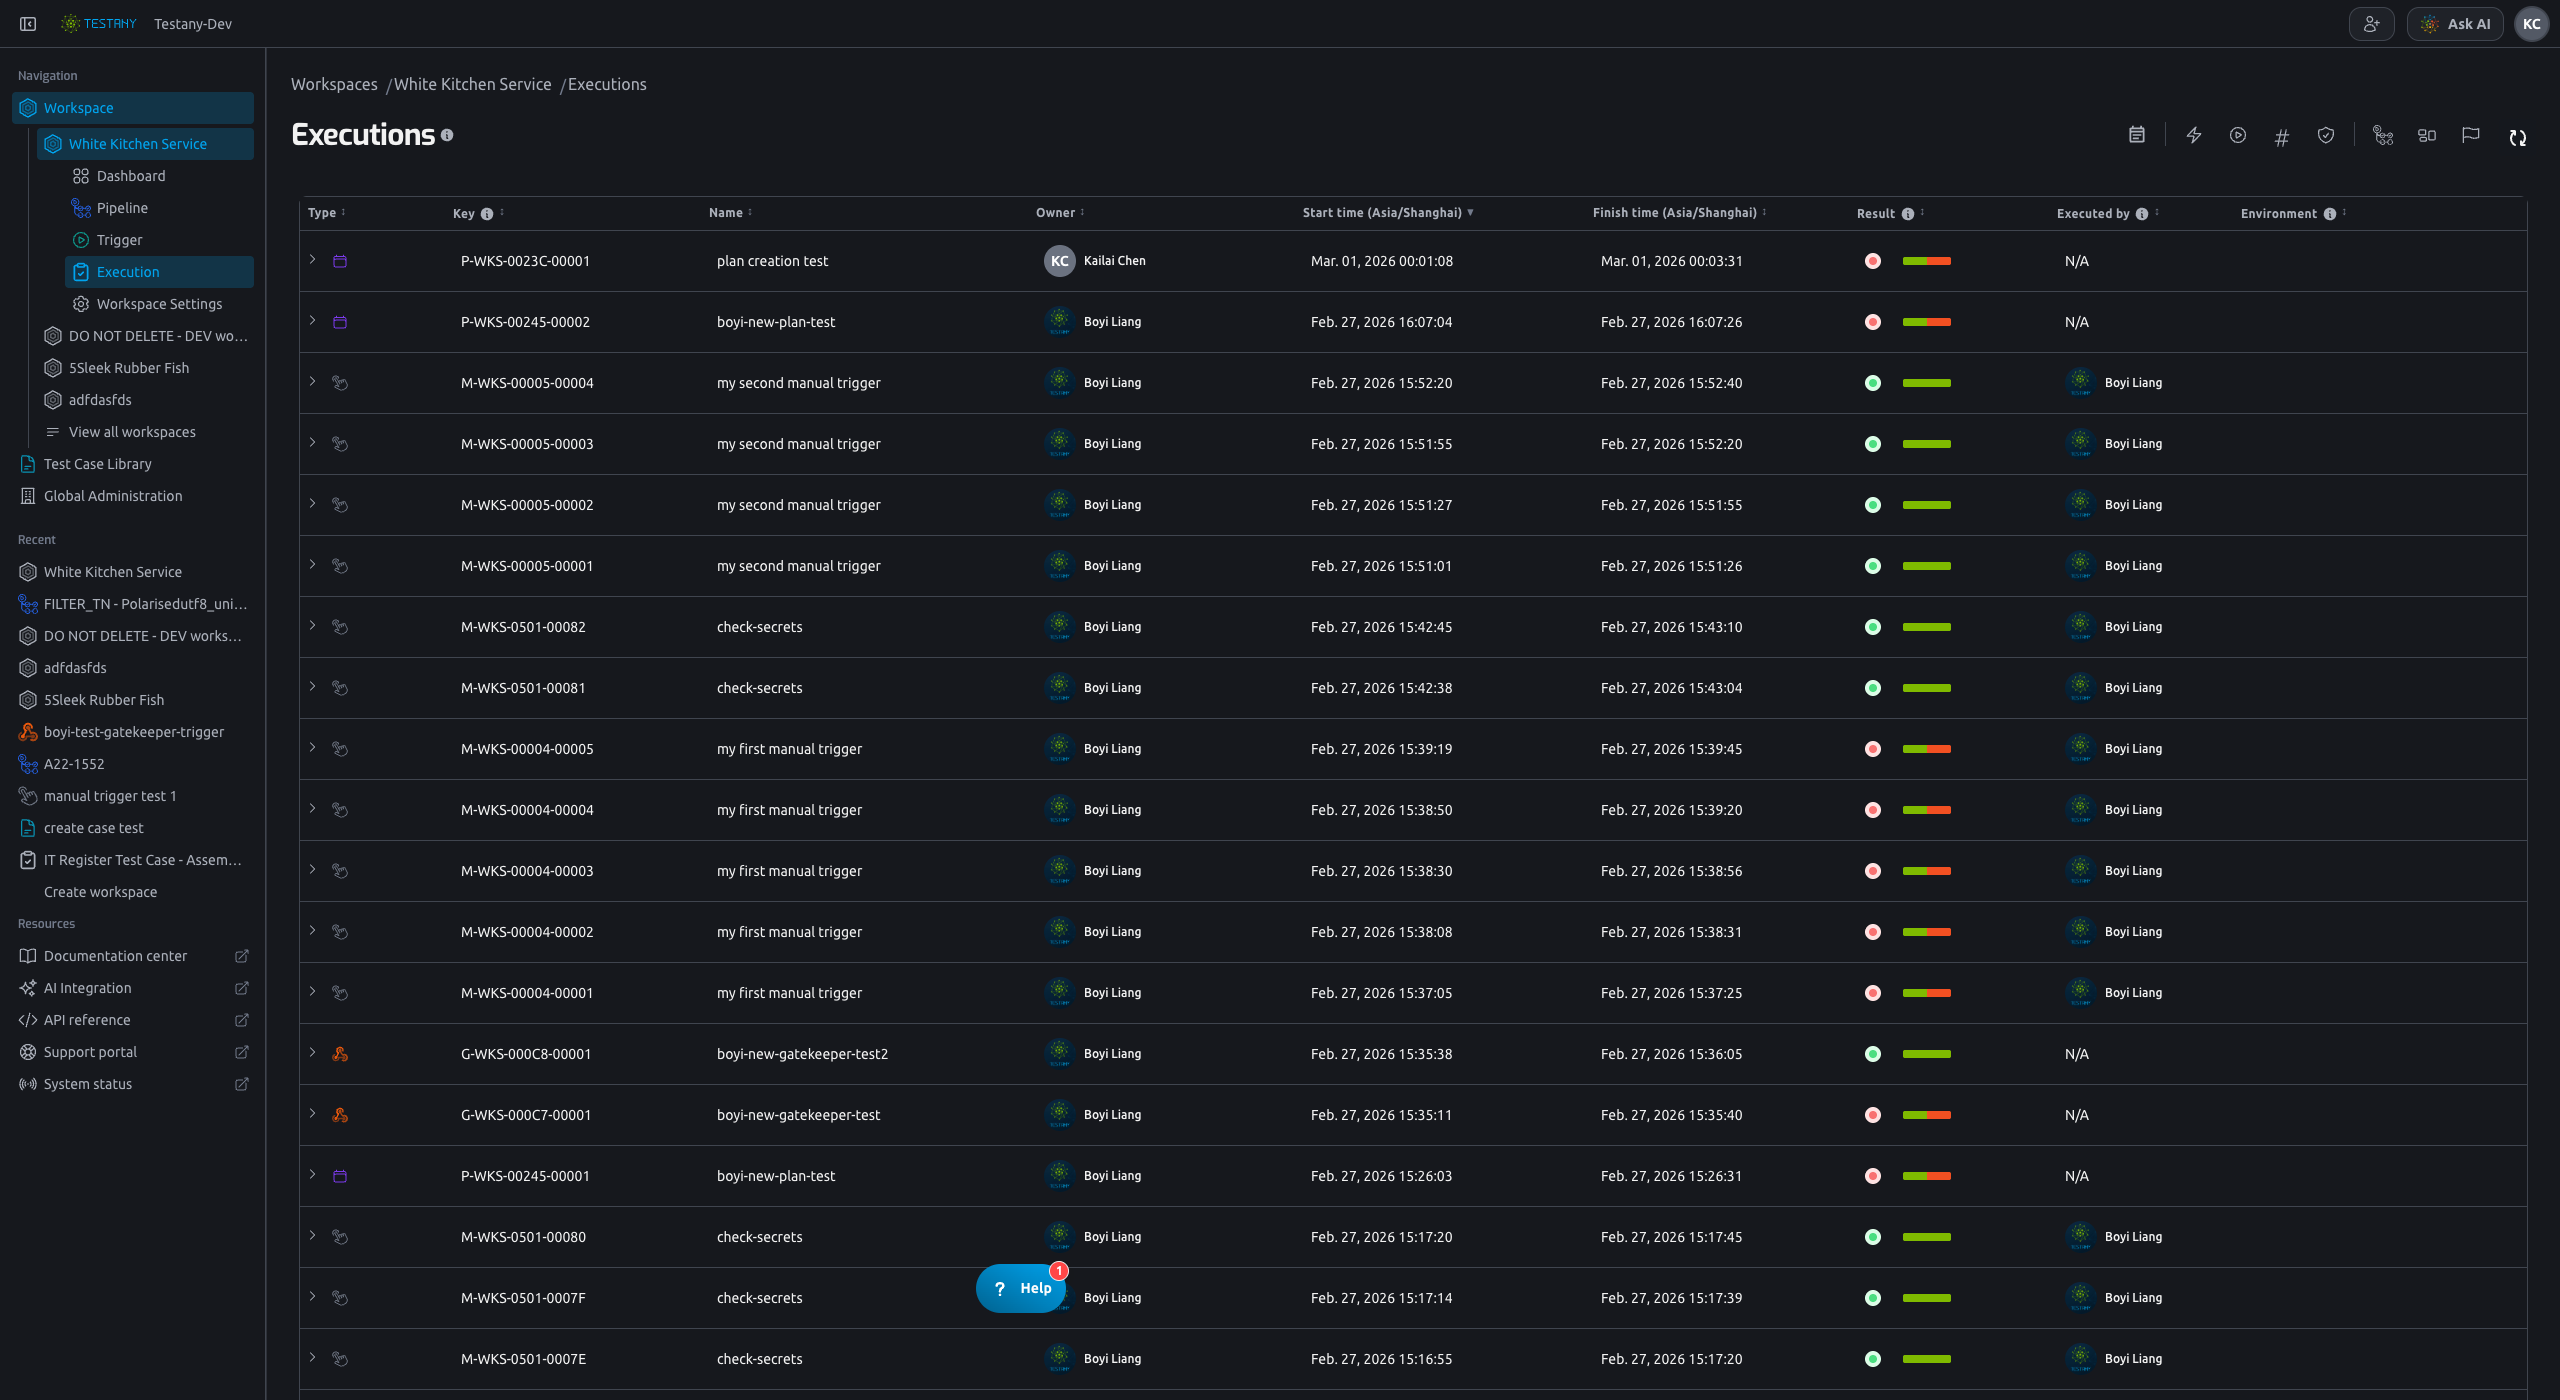
1. Use filters first (current implementation)
The current filter bar is grouped into:
- one global filter (
Date Range) - parent-level filters (
Trigger Source,Trigger,Trigger ID,Trigger Status) - child-level filters (
Pipeline,Execution Environment,Execution Status)
For incident analysis, keep a short date window first, then add other filters.
Date Range
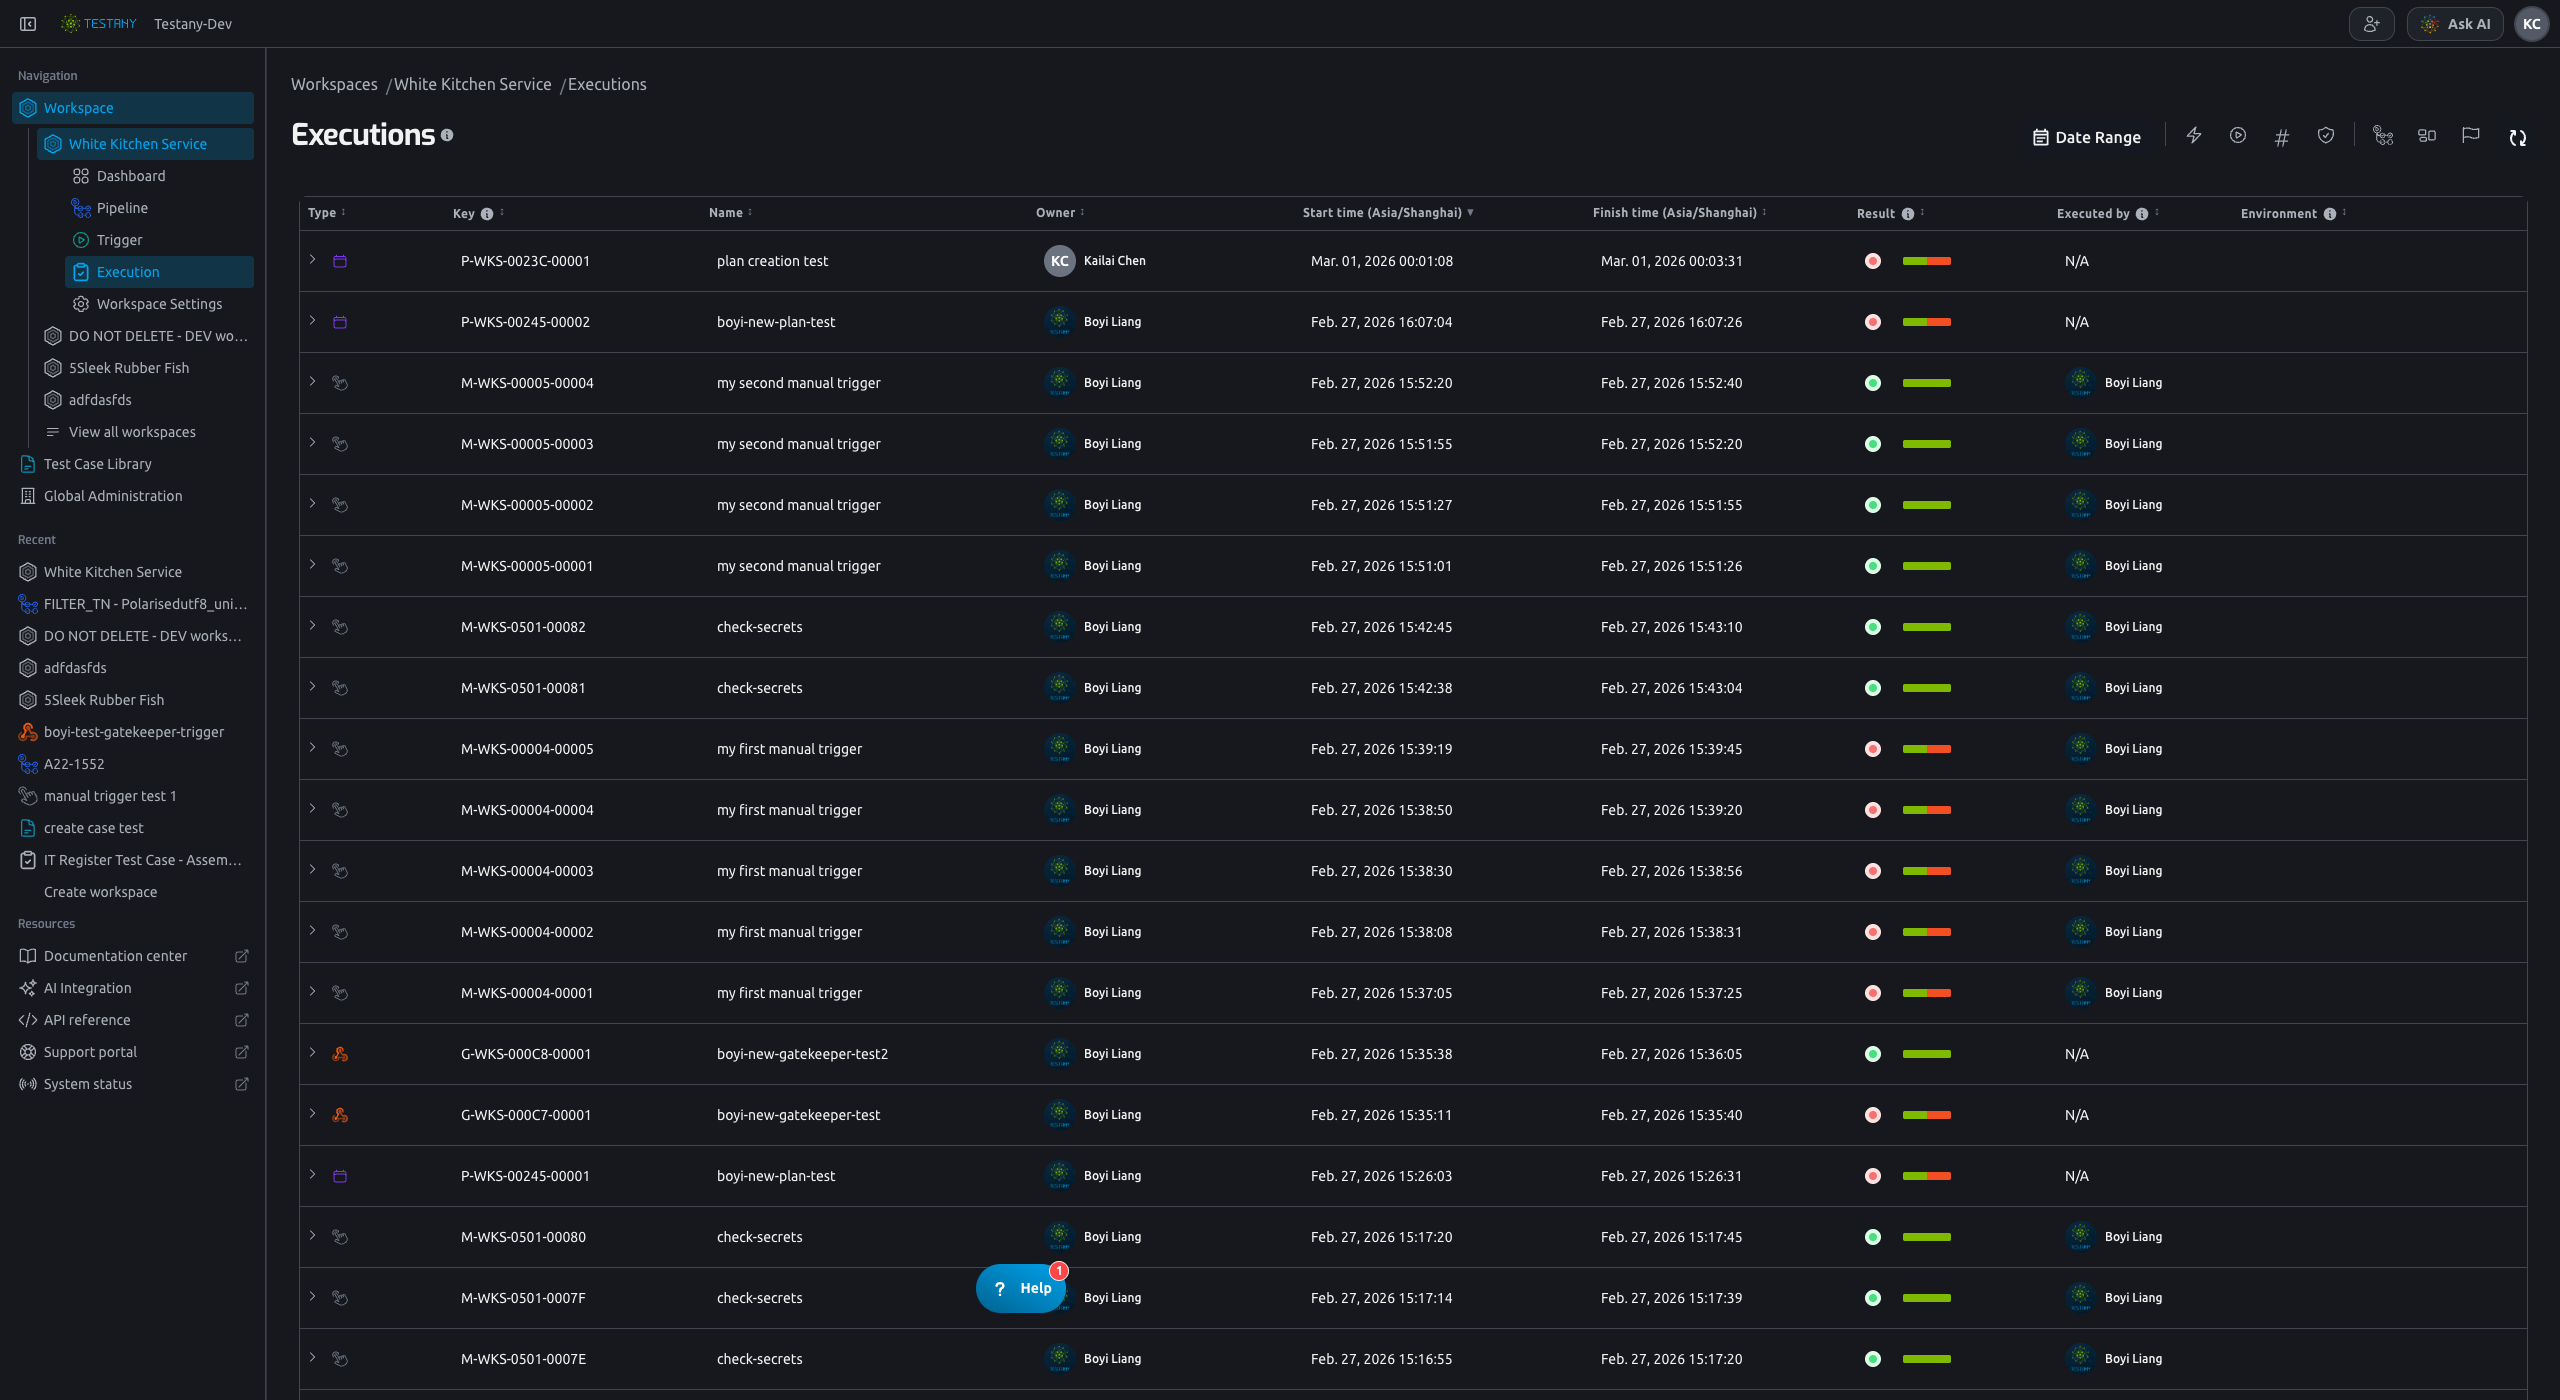
- Filters by execution start date range.
- The page converts your selected dates into UTC boundaries automatically.
Trigger Source
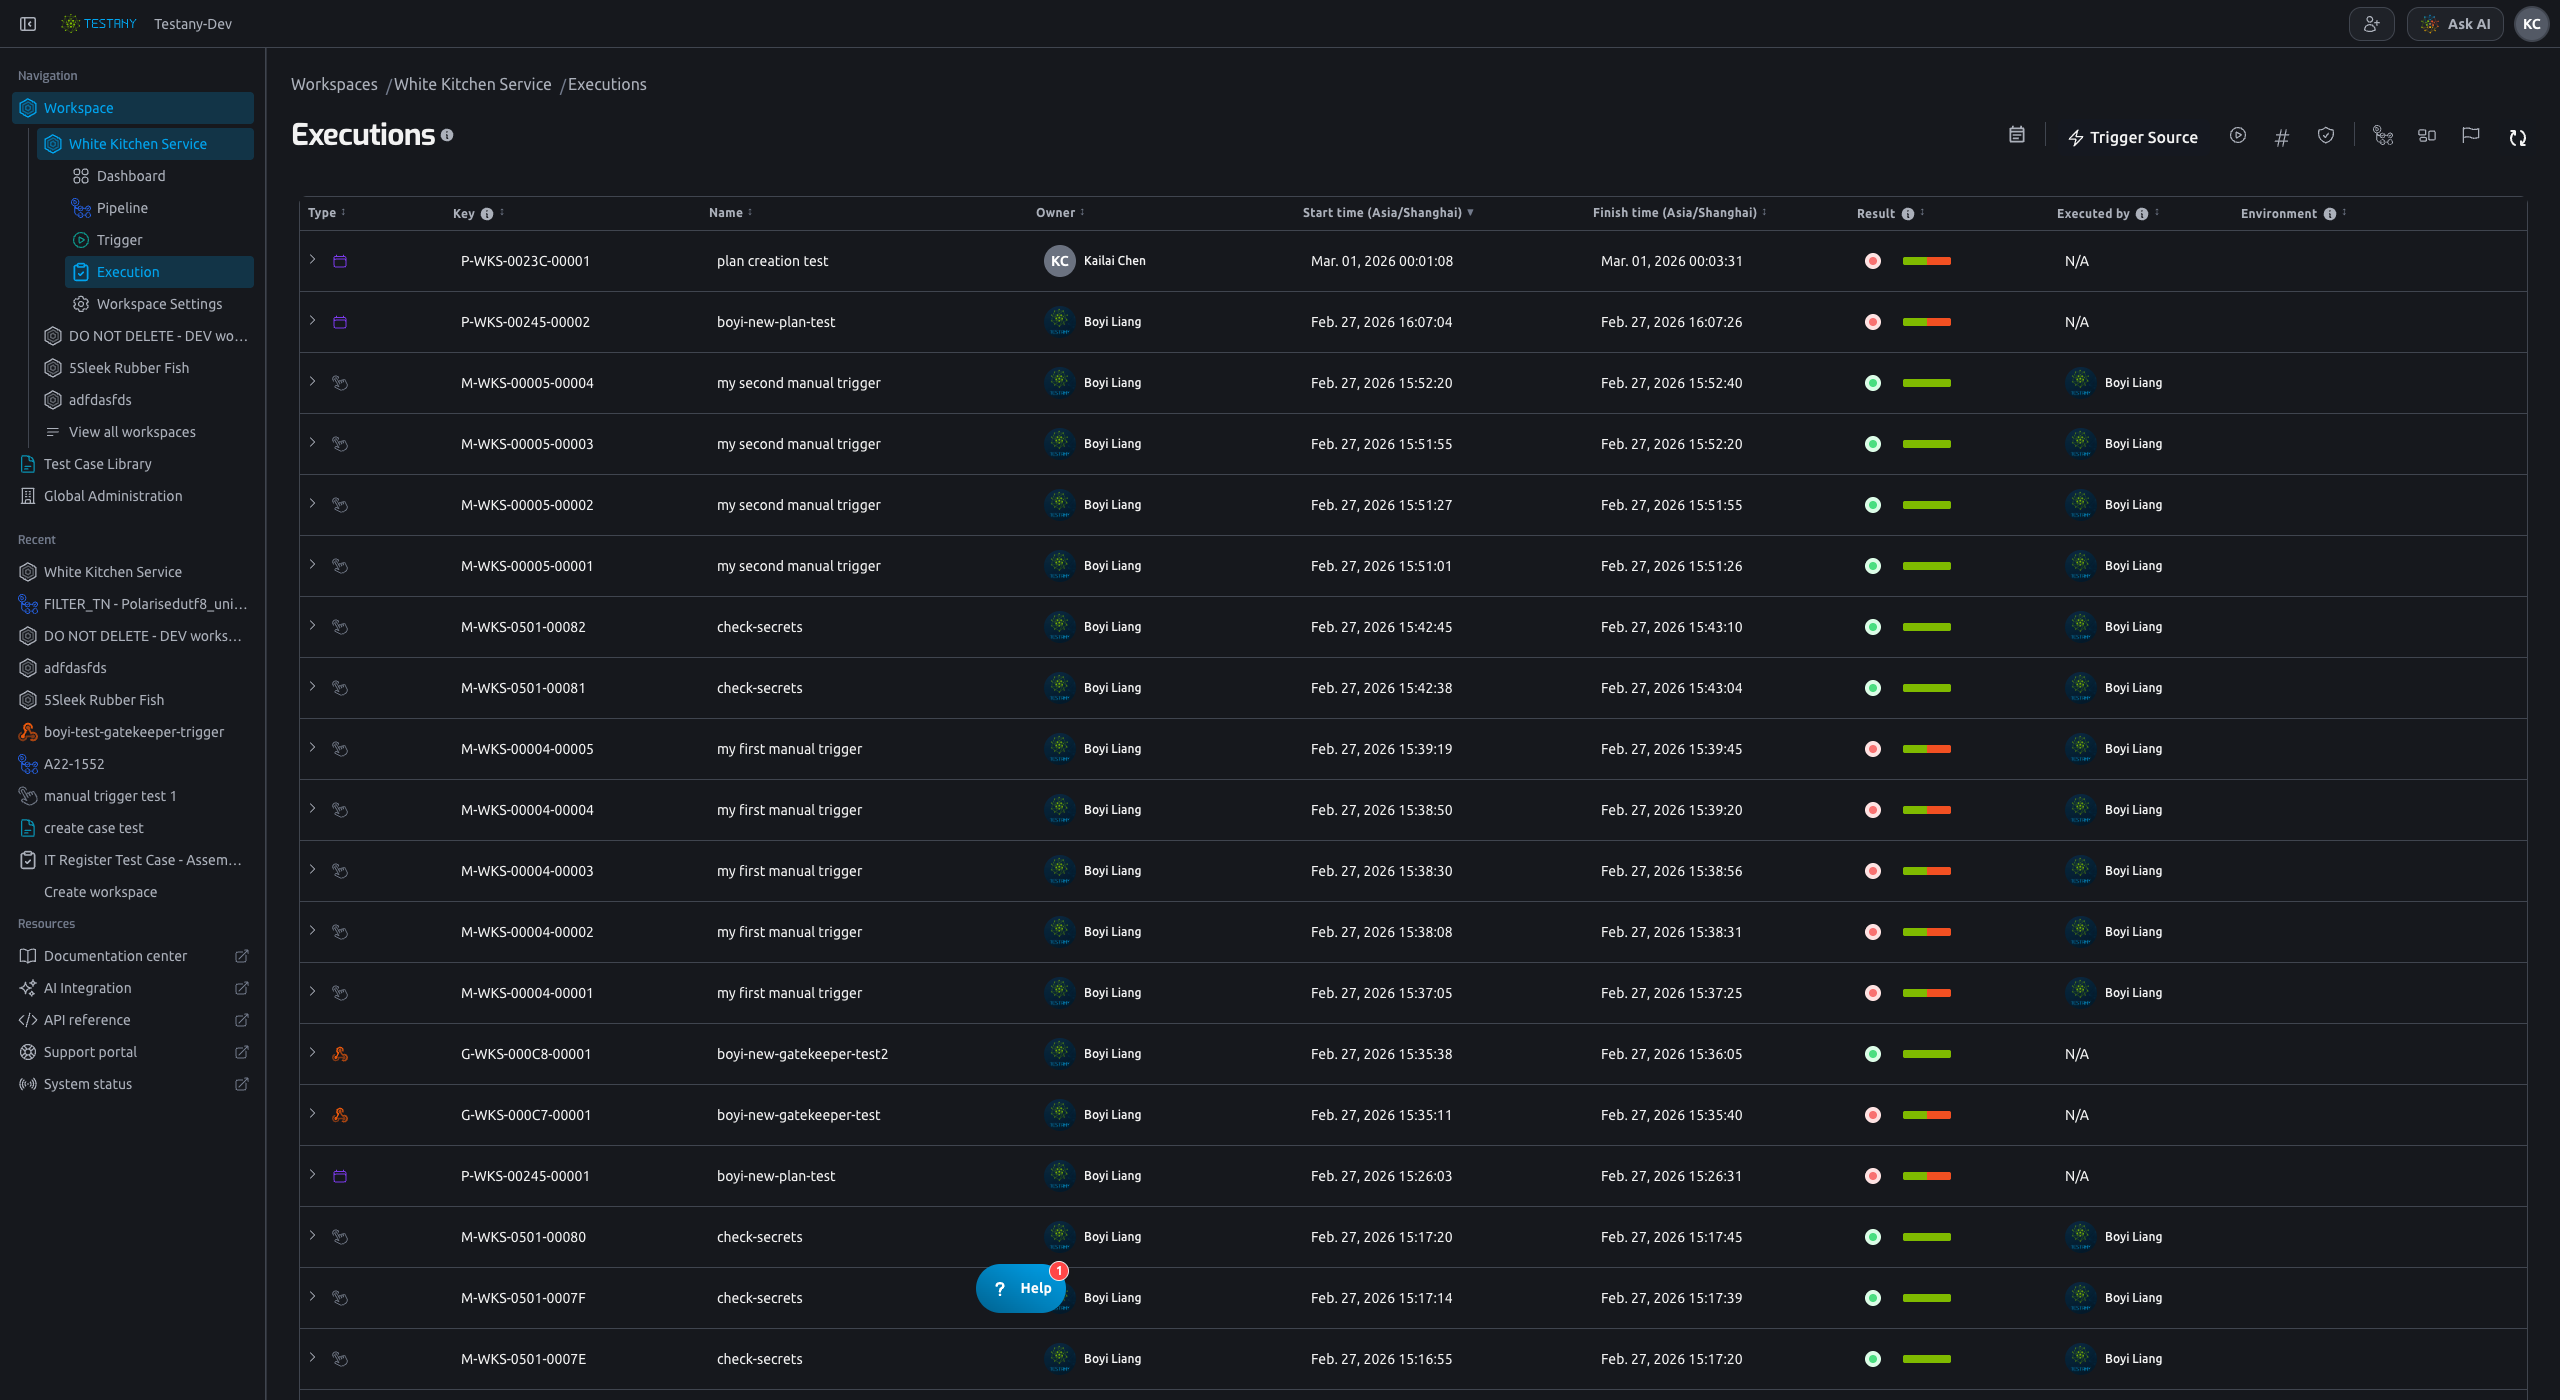
- Source values are:
Plan,Gatekeeper,Manual Trigger,Single Run. - This filter constrains the available options in
Trigger.
Trigger
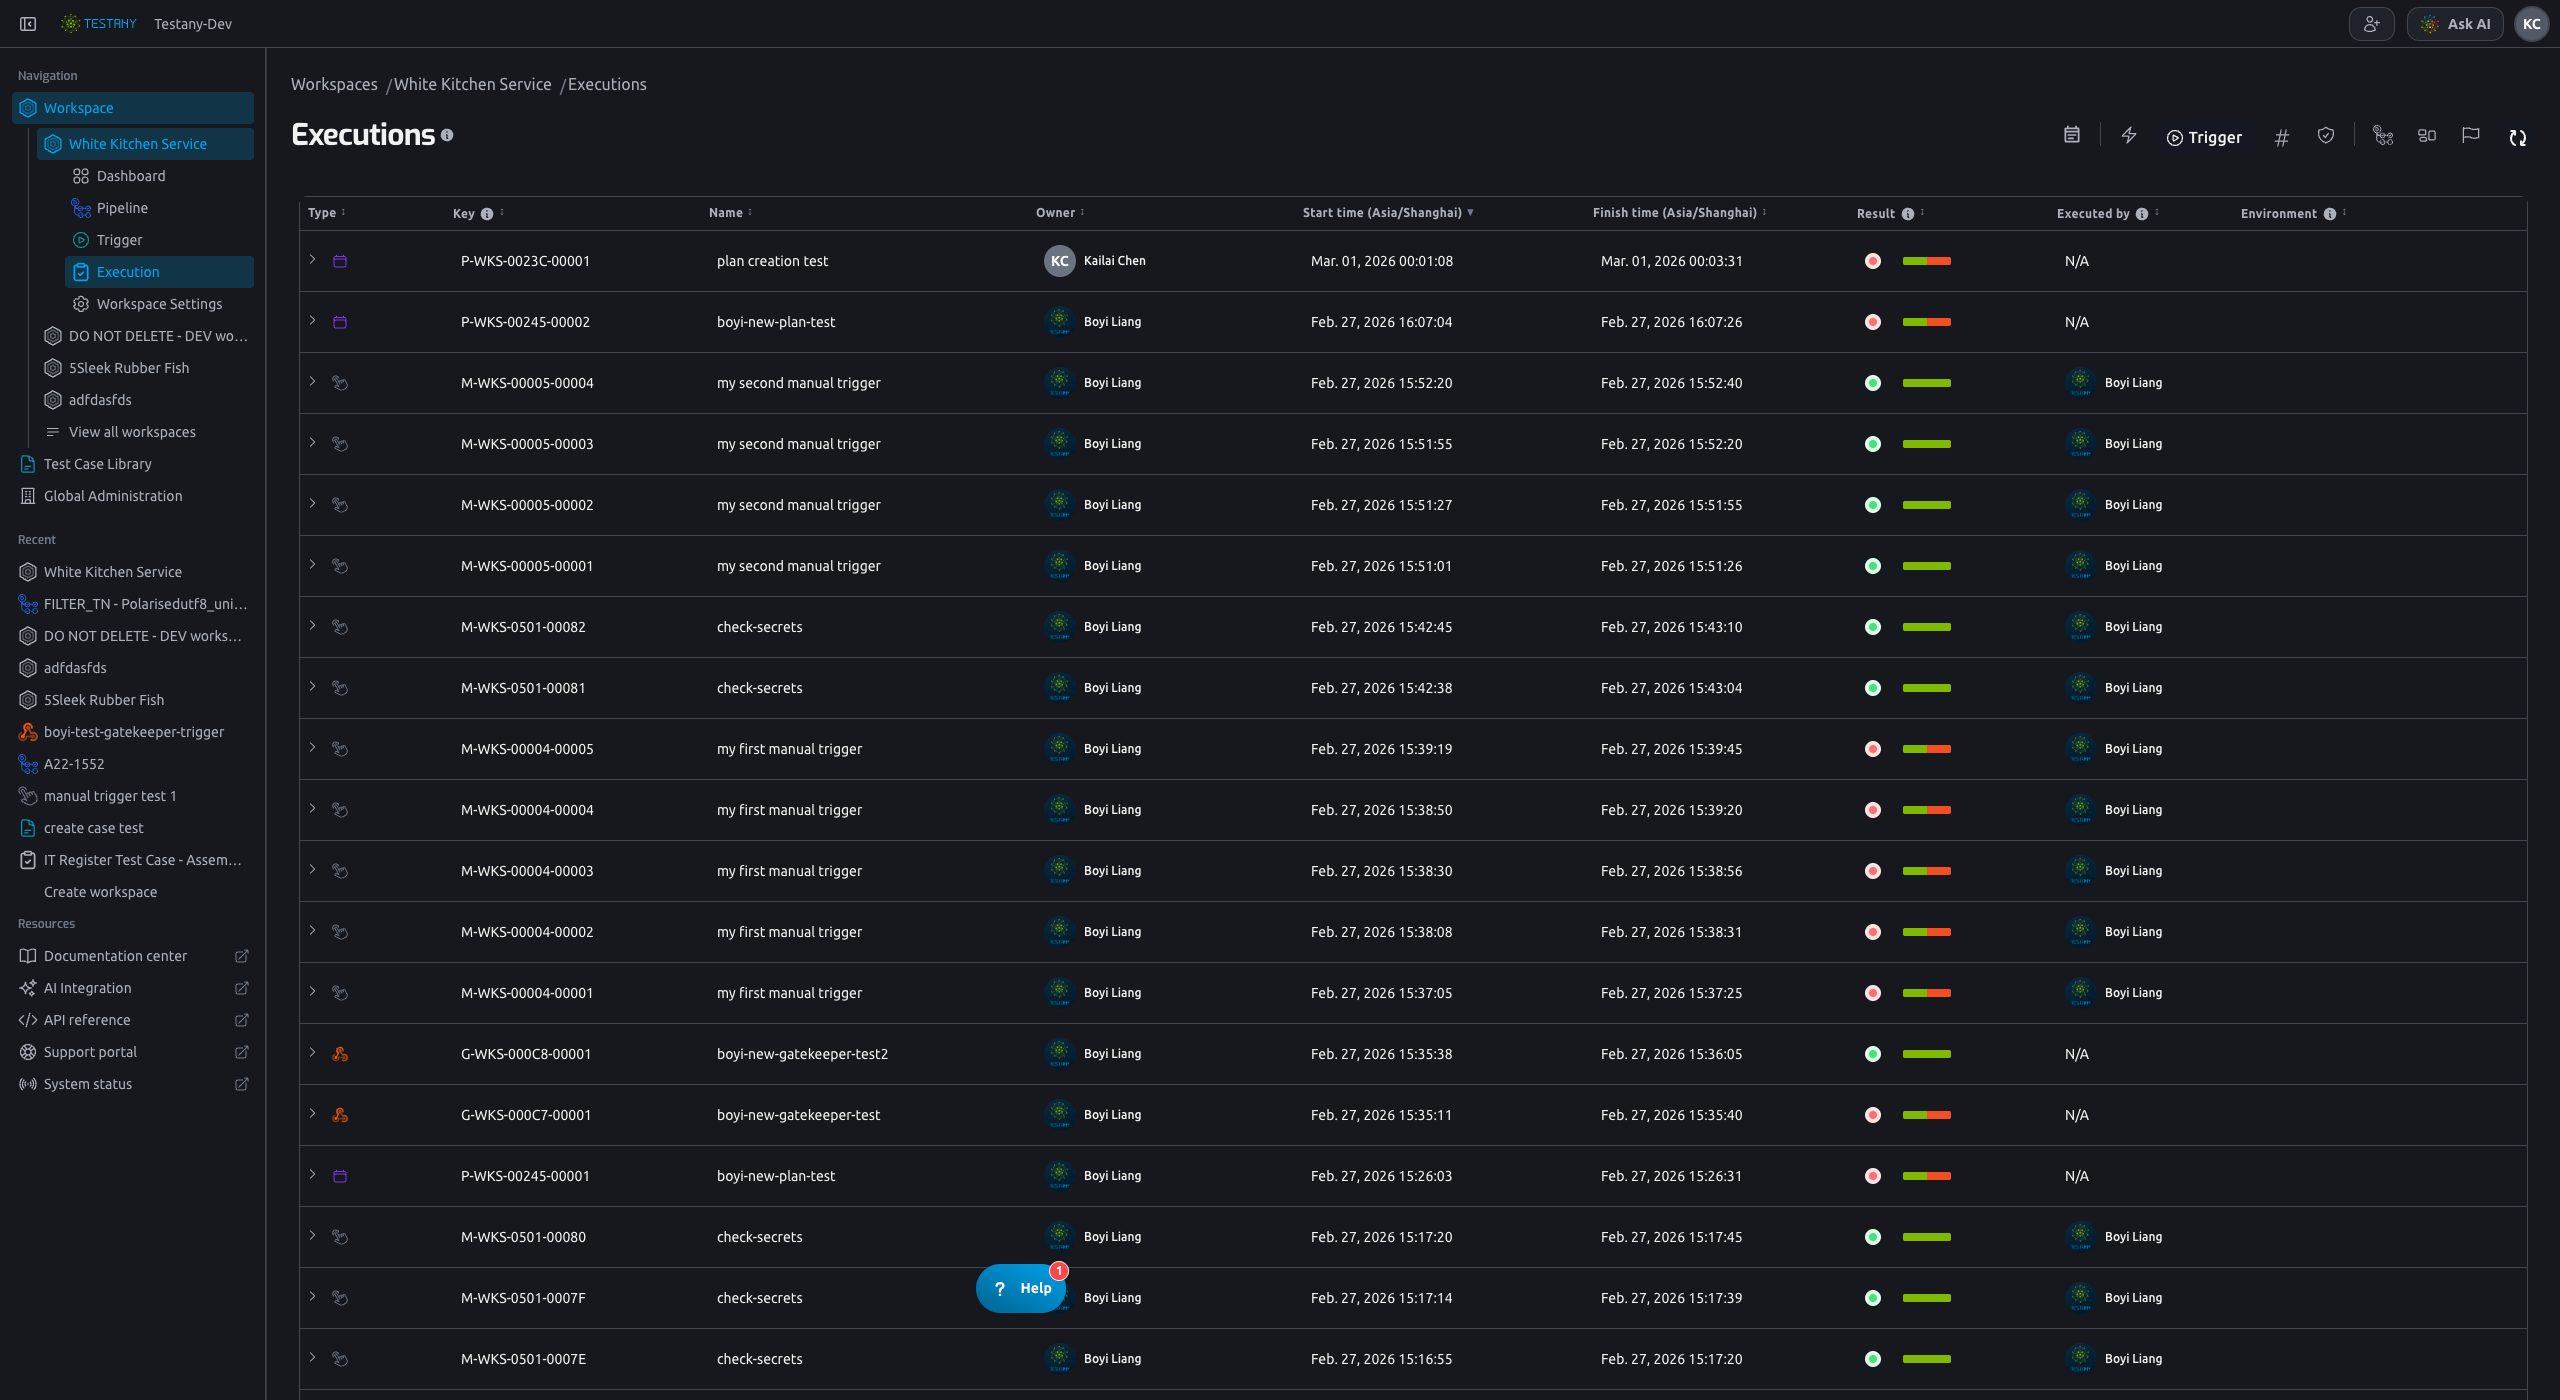
- Multi-select supported.
- Options are loaded dynamically based on current filter combination.
Trigger ID
Trigger IDis a direct input filter for exact ID matching.- Useful when you already have a specific trigger-related ID from another page or message.
Trigger Status
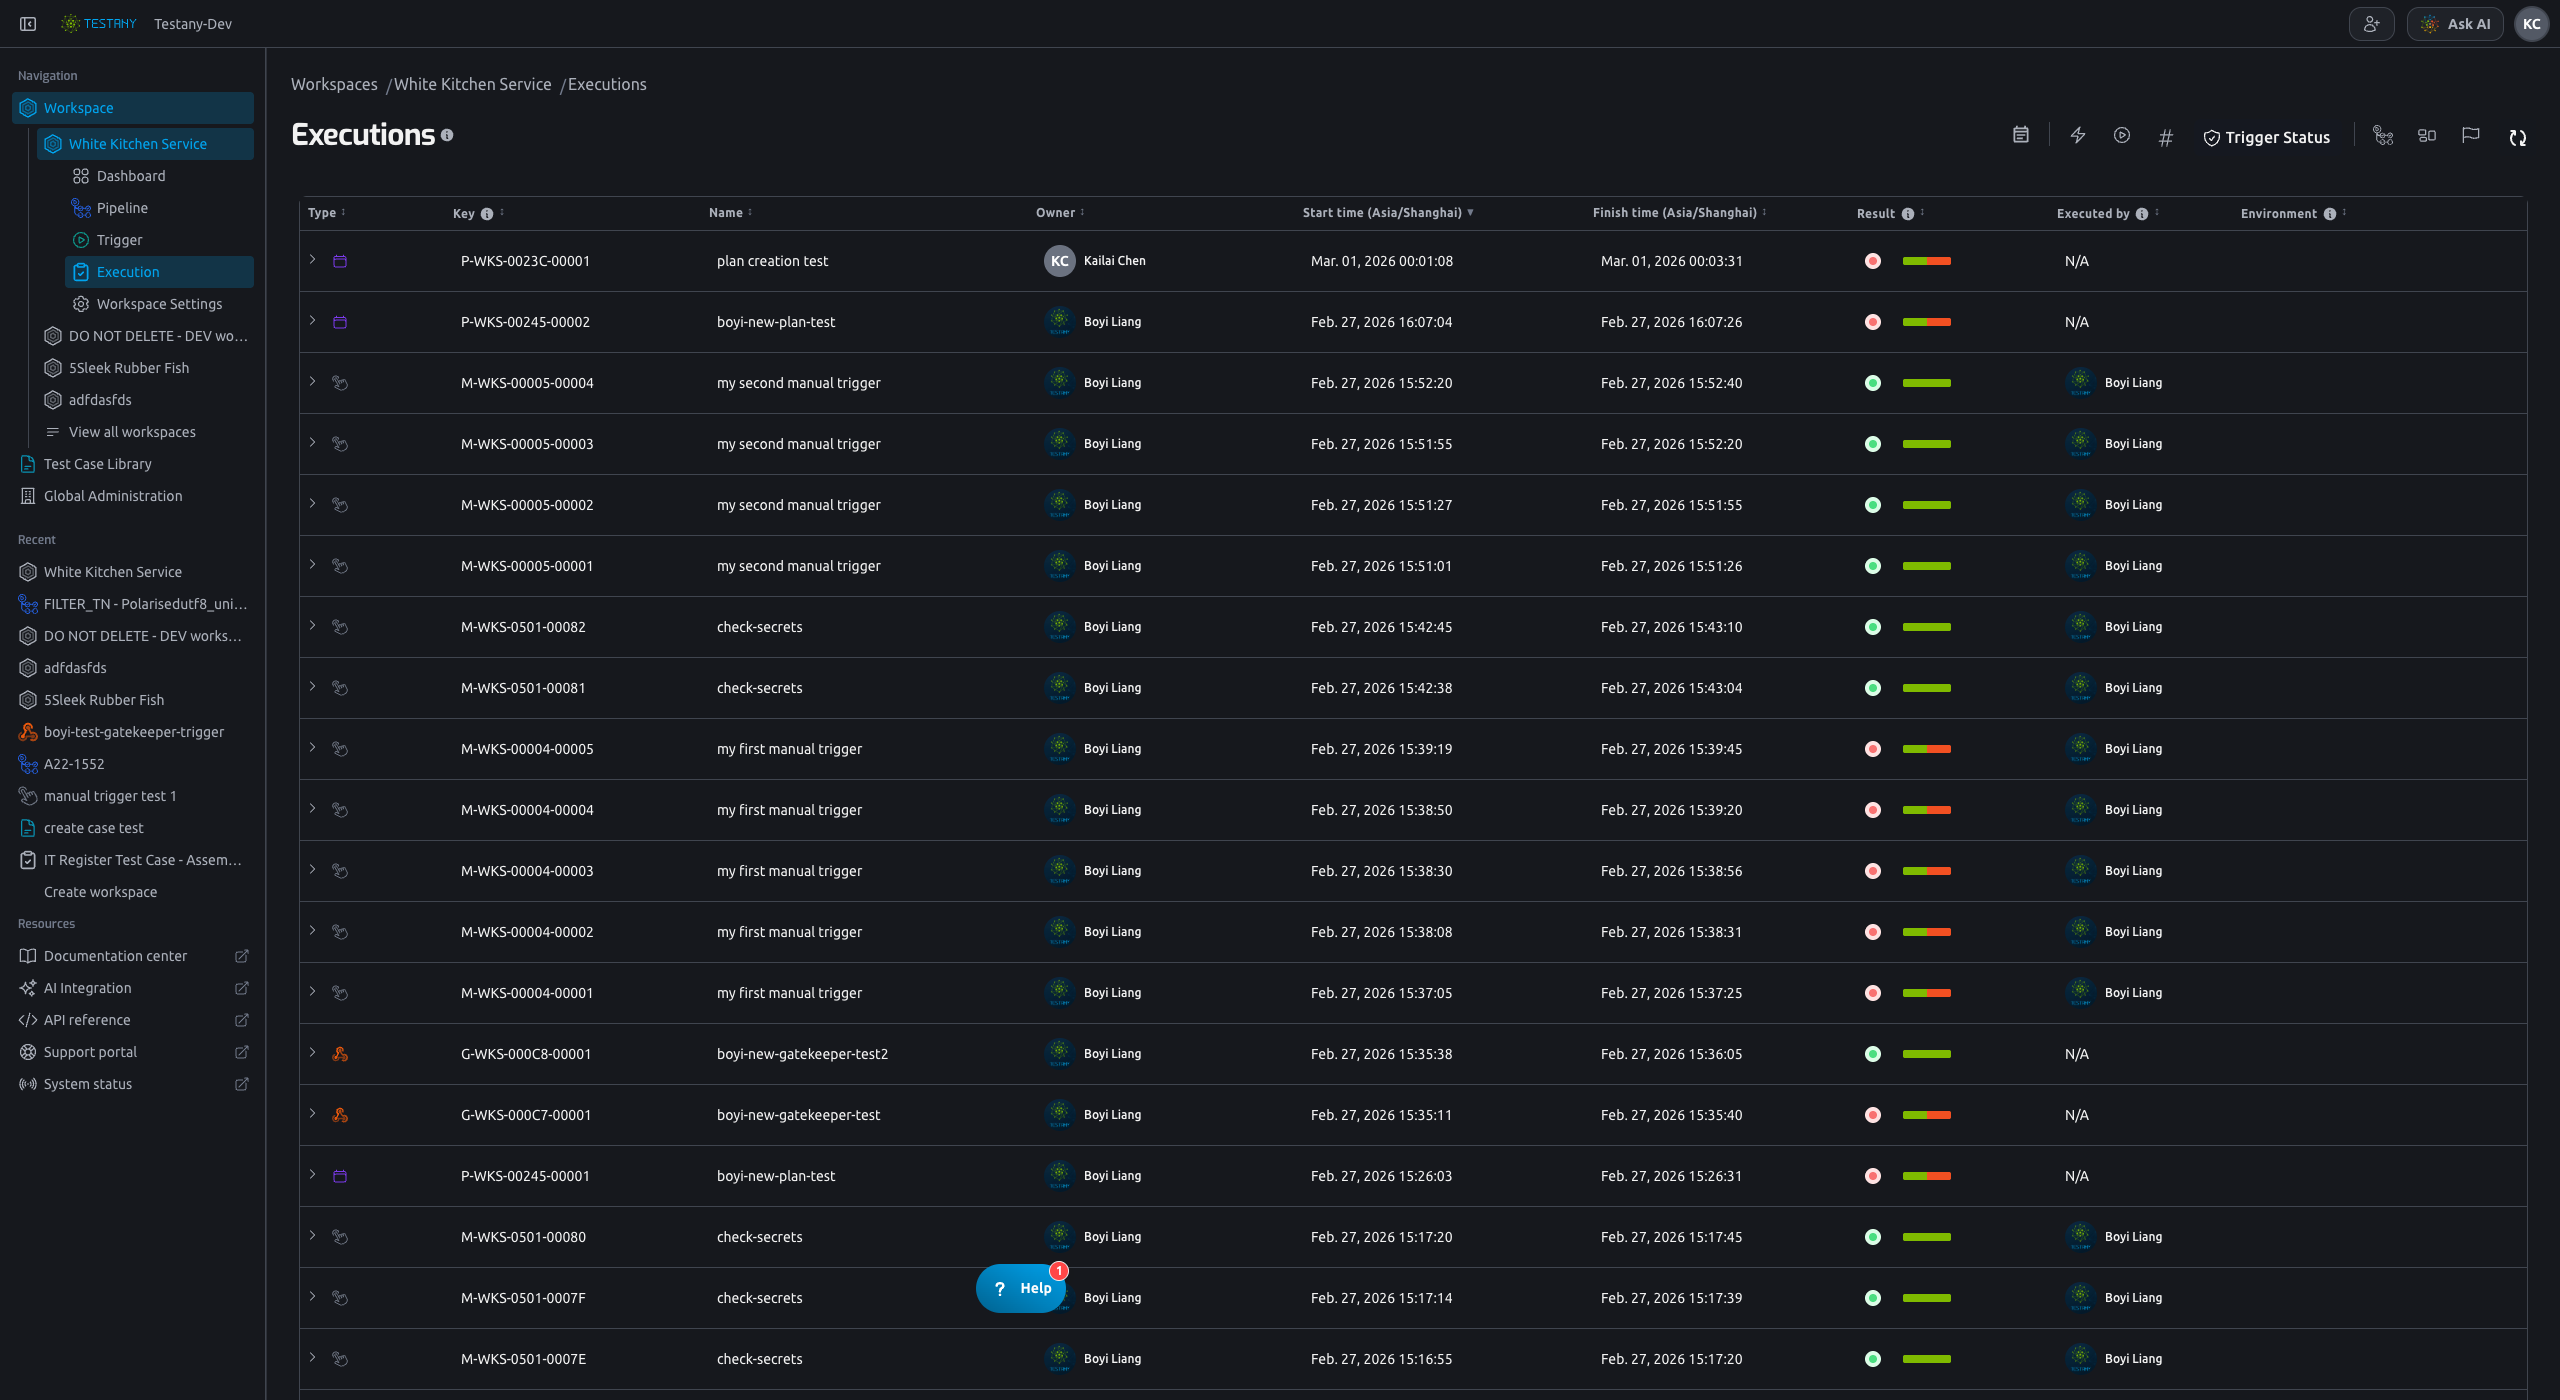
- Filters parent rows (
Trigger Instance) by status.
Pipeline
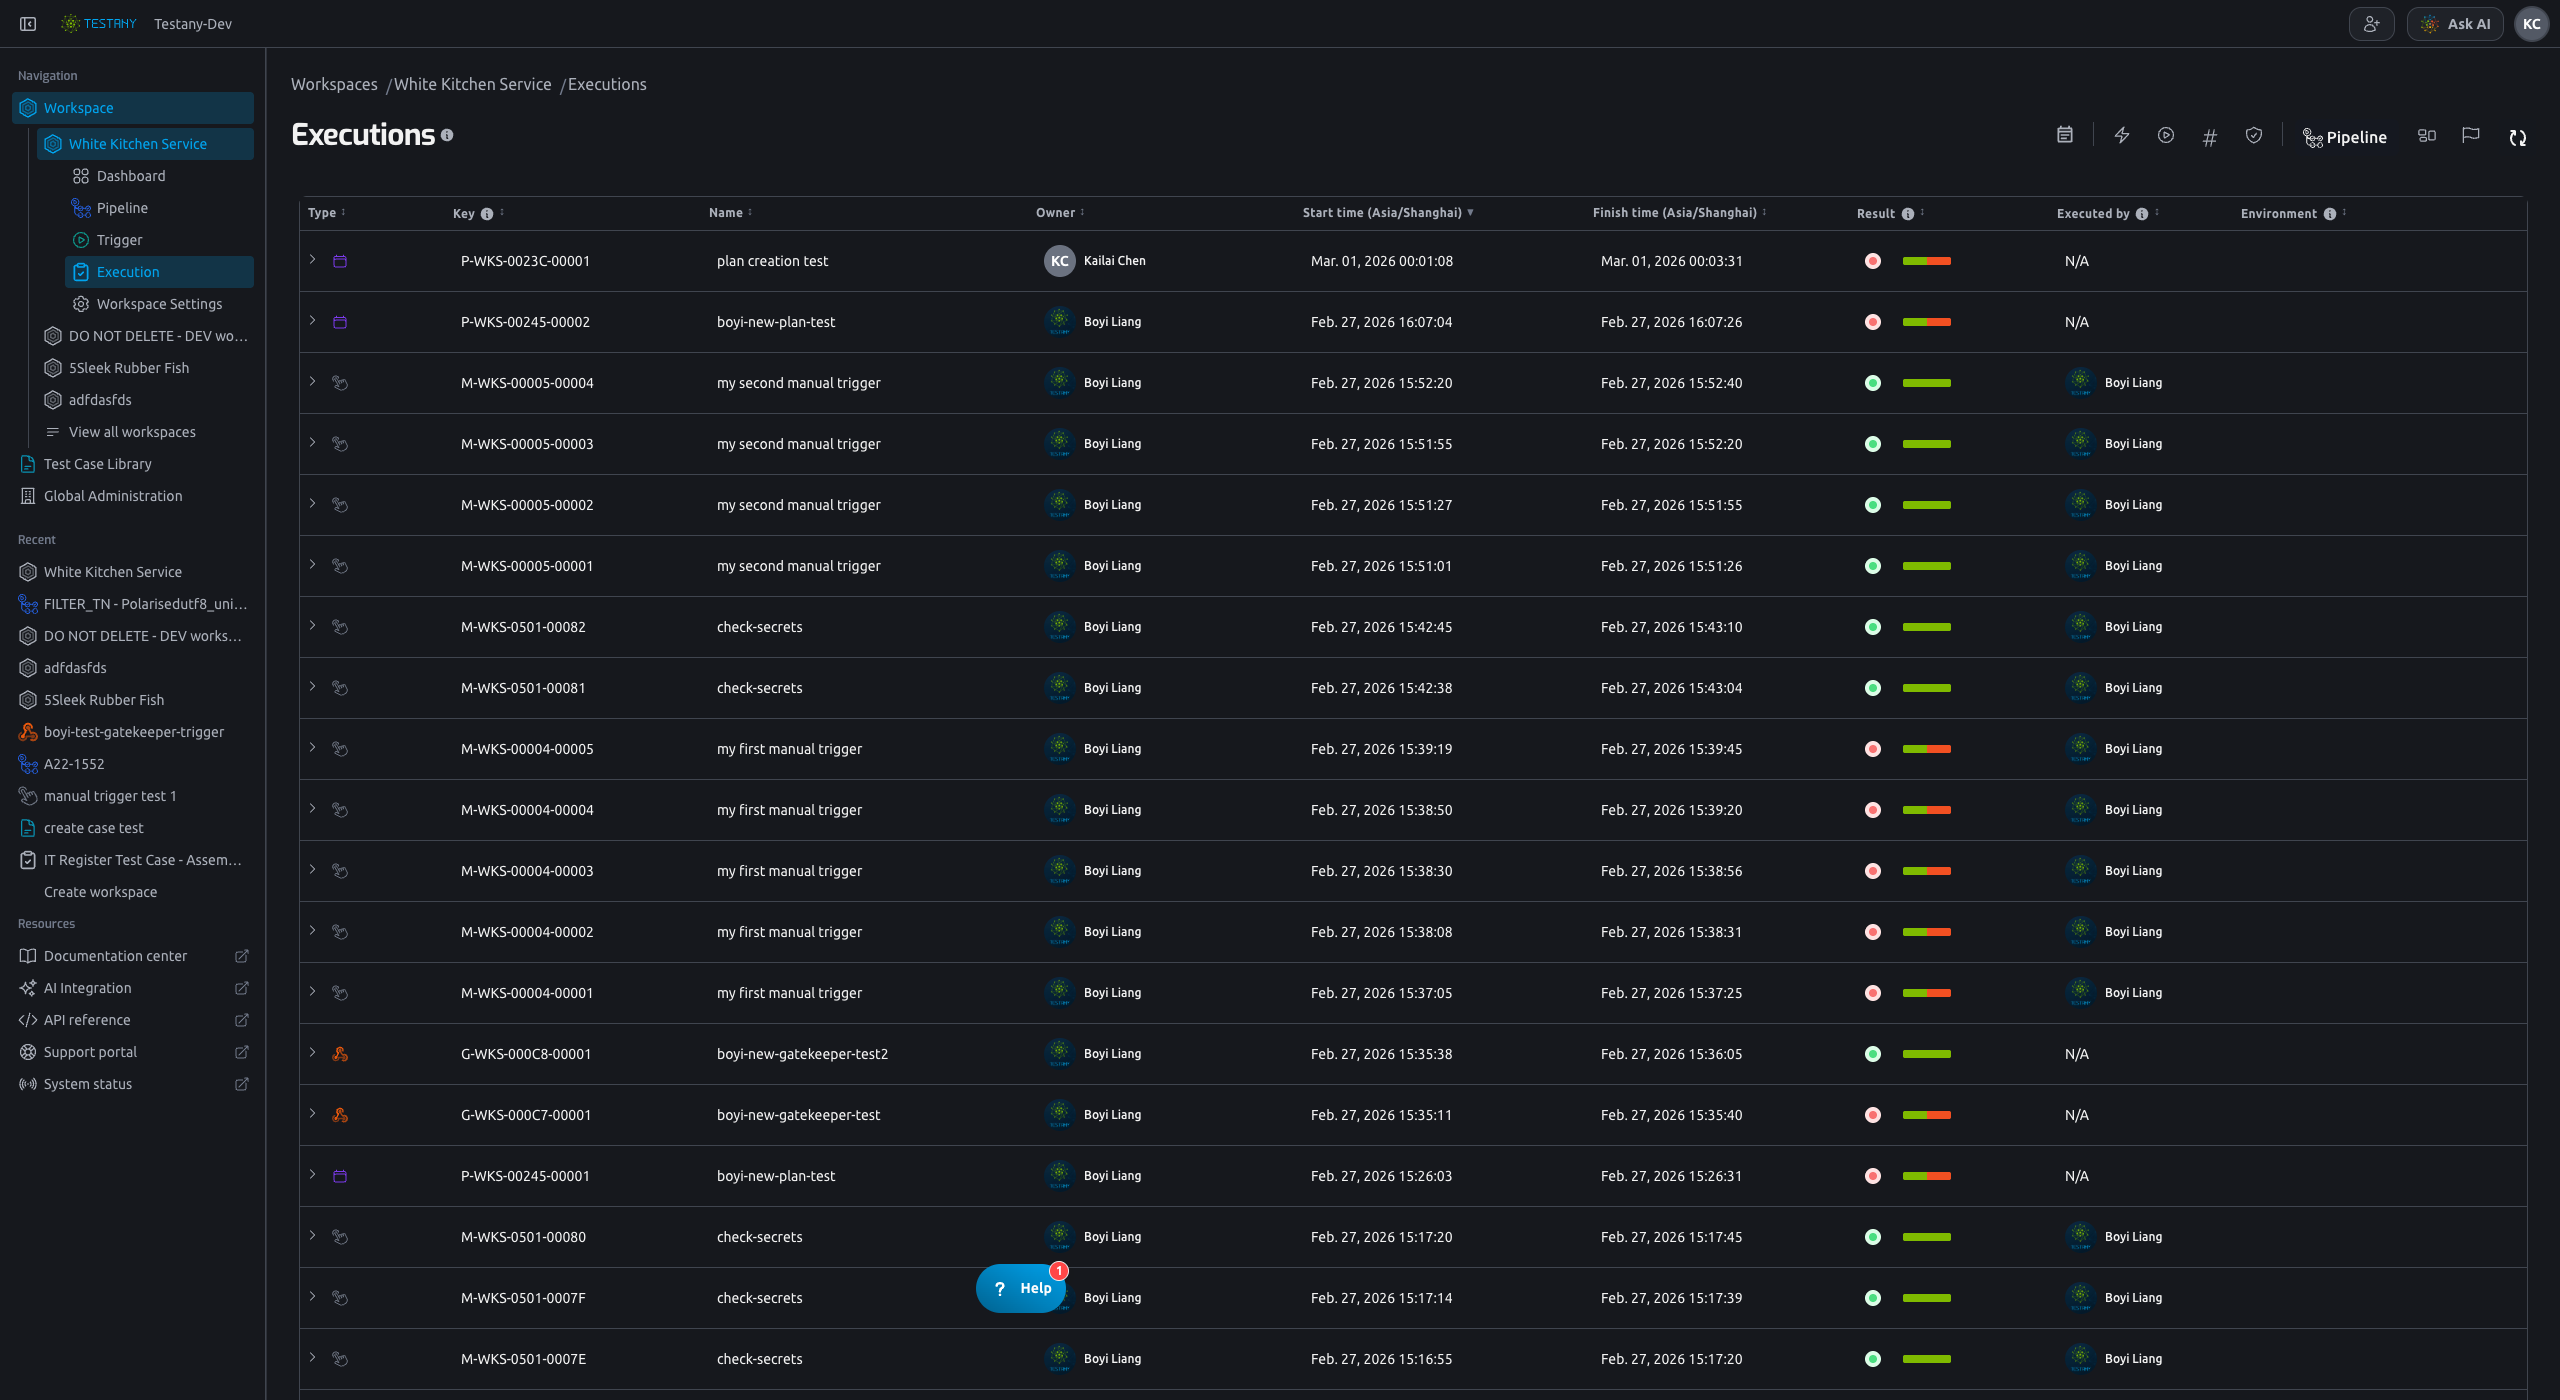
- Filters child rows (
Pipeline execution) by pipeline.
Execution Environment
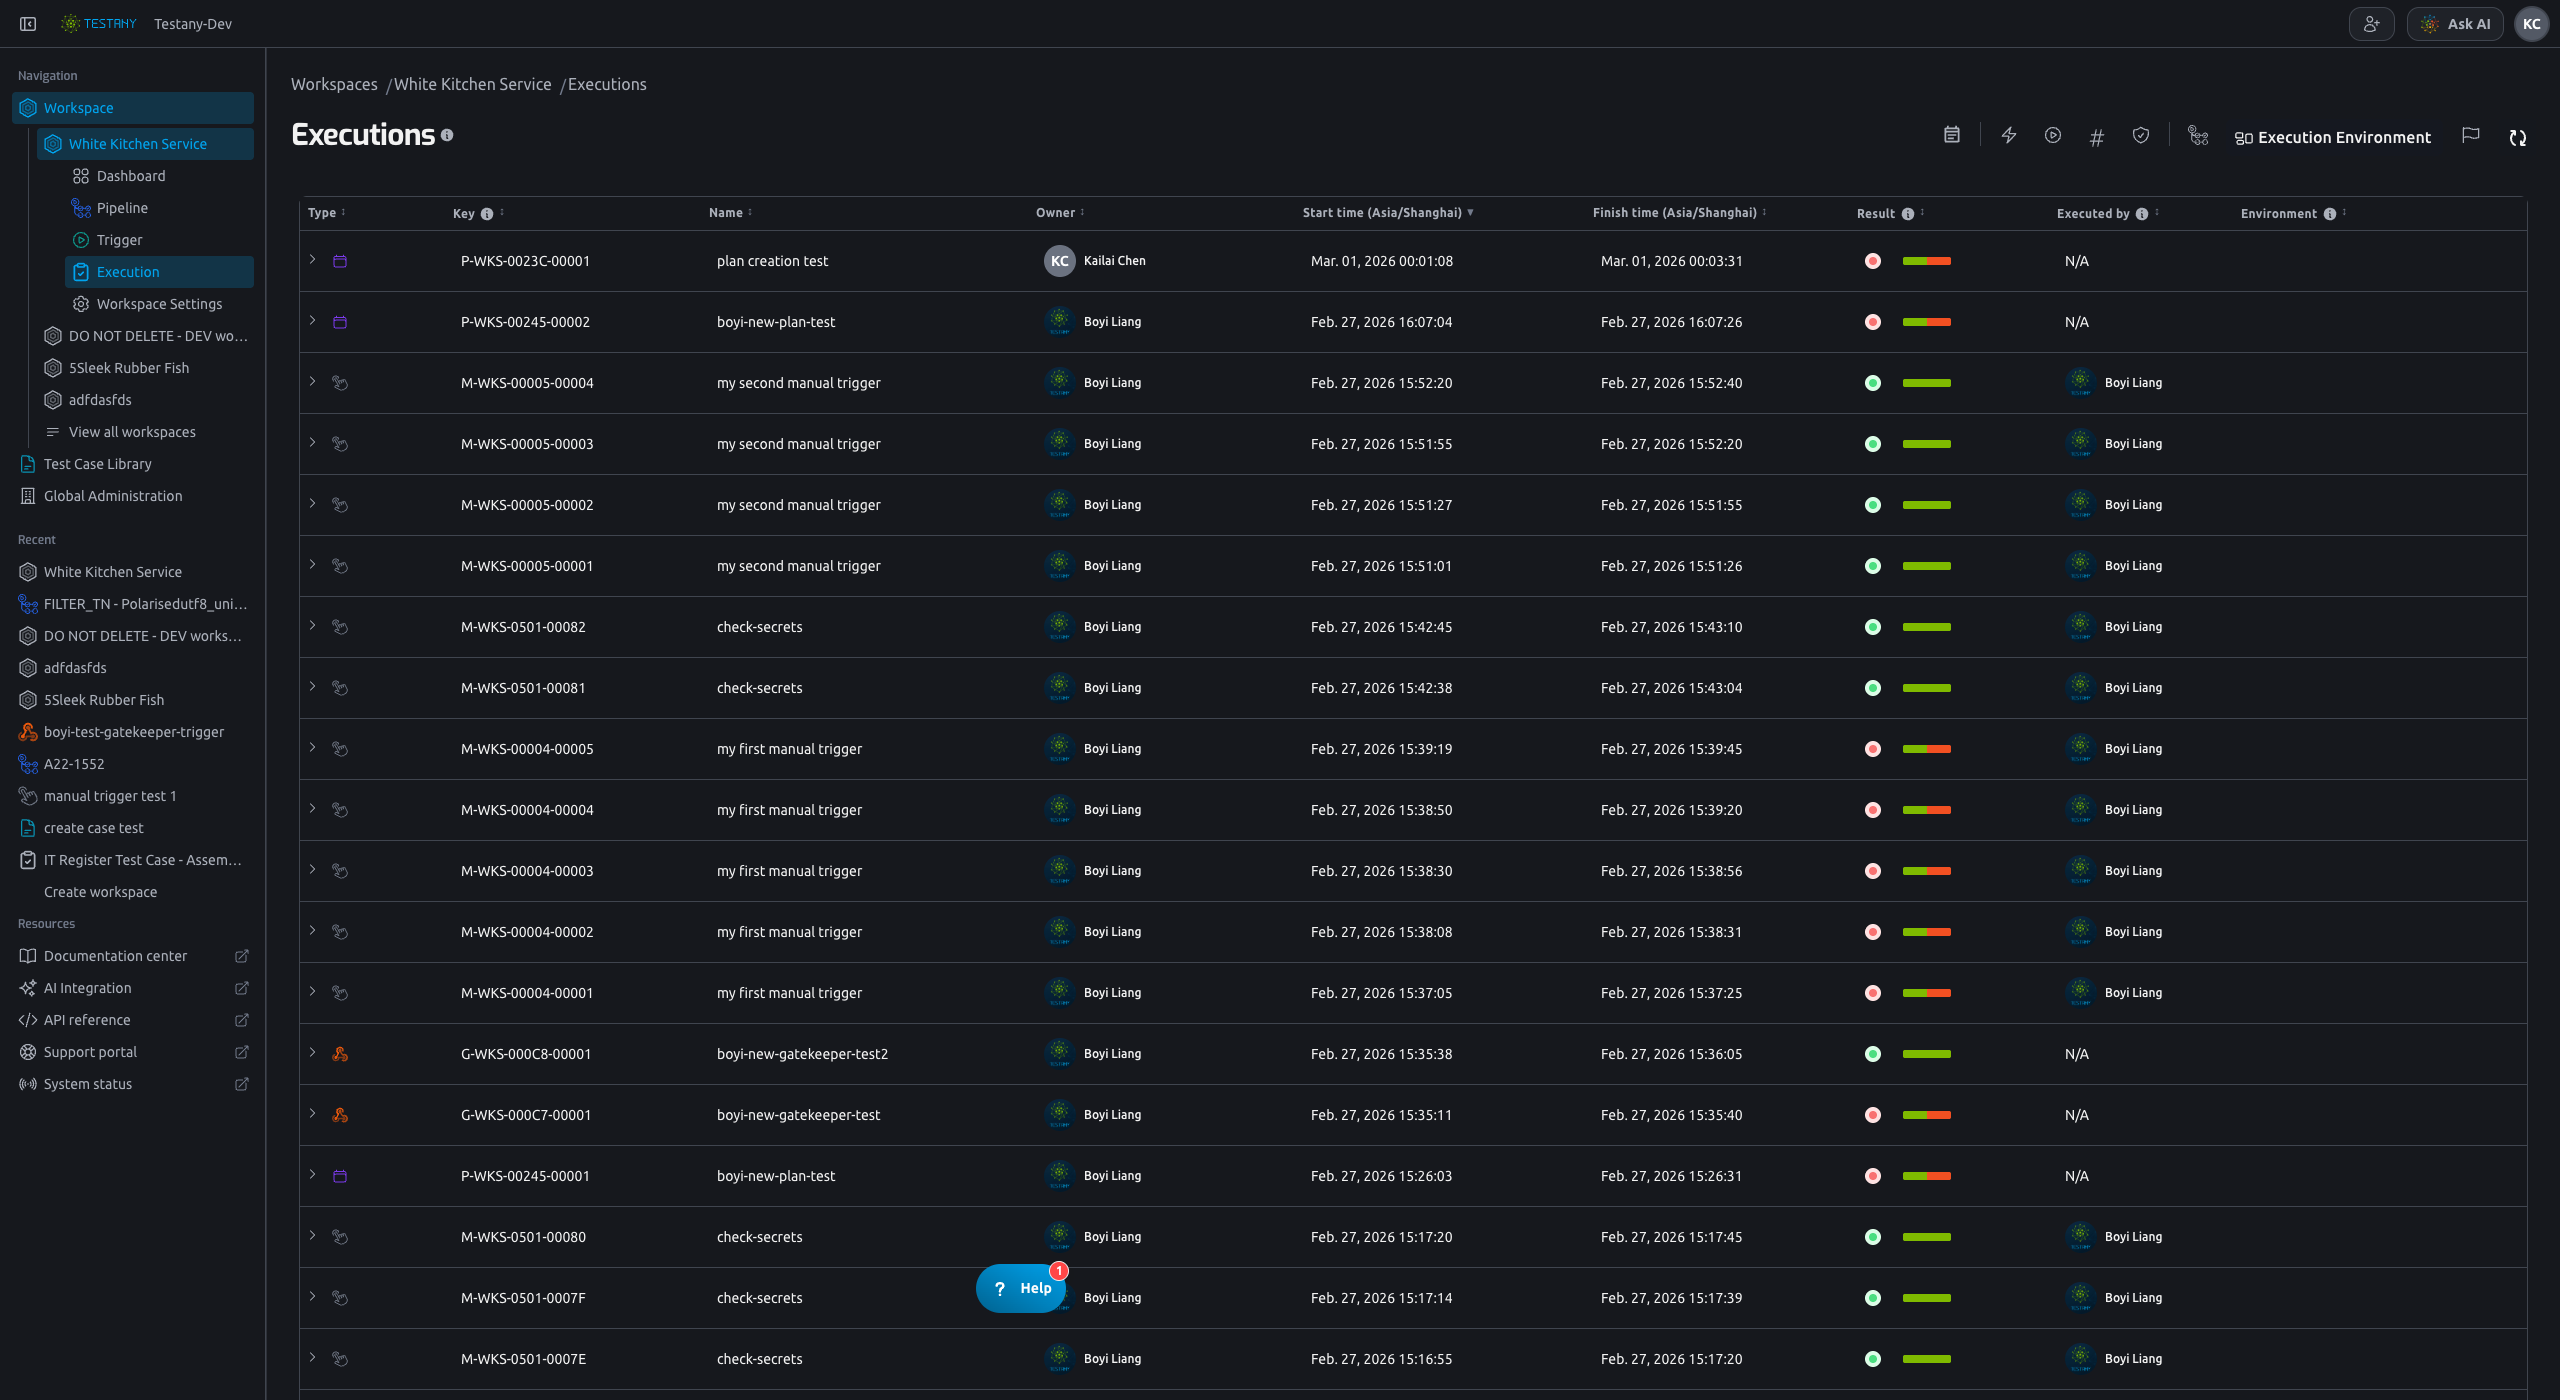
- Filters child rows by execution environment.
Execution Status
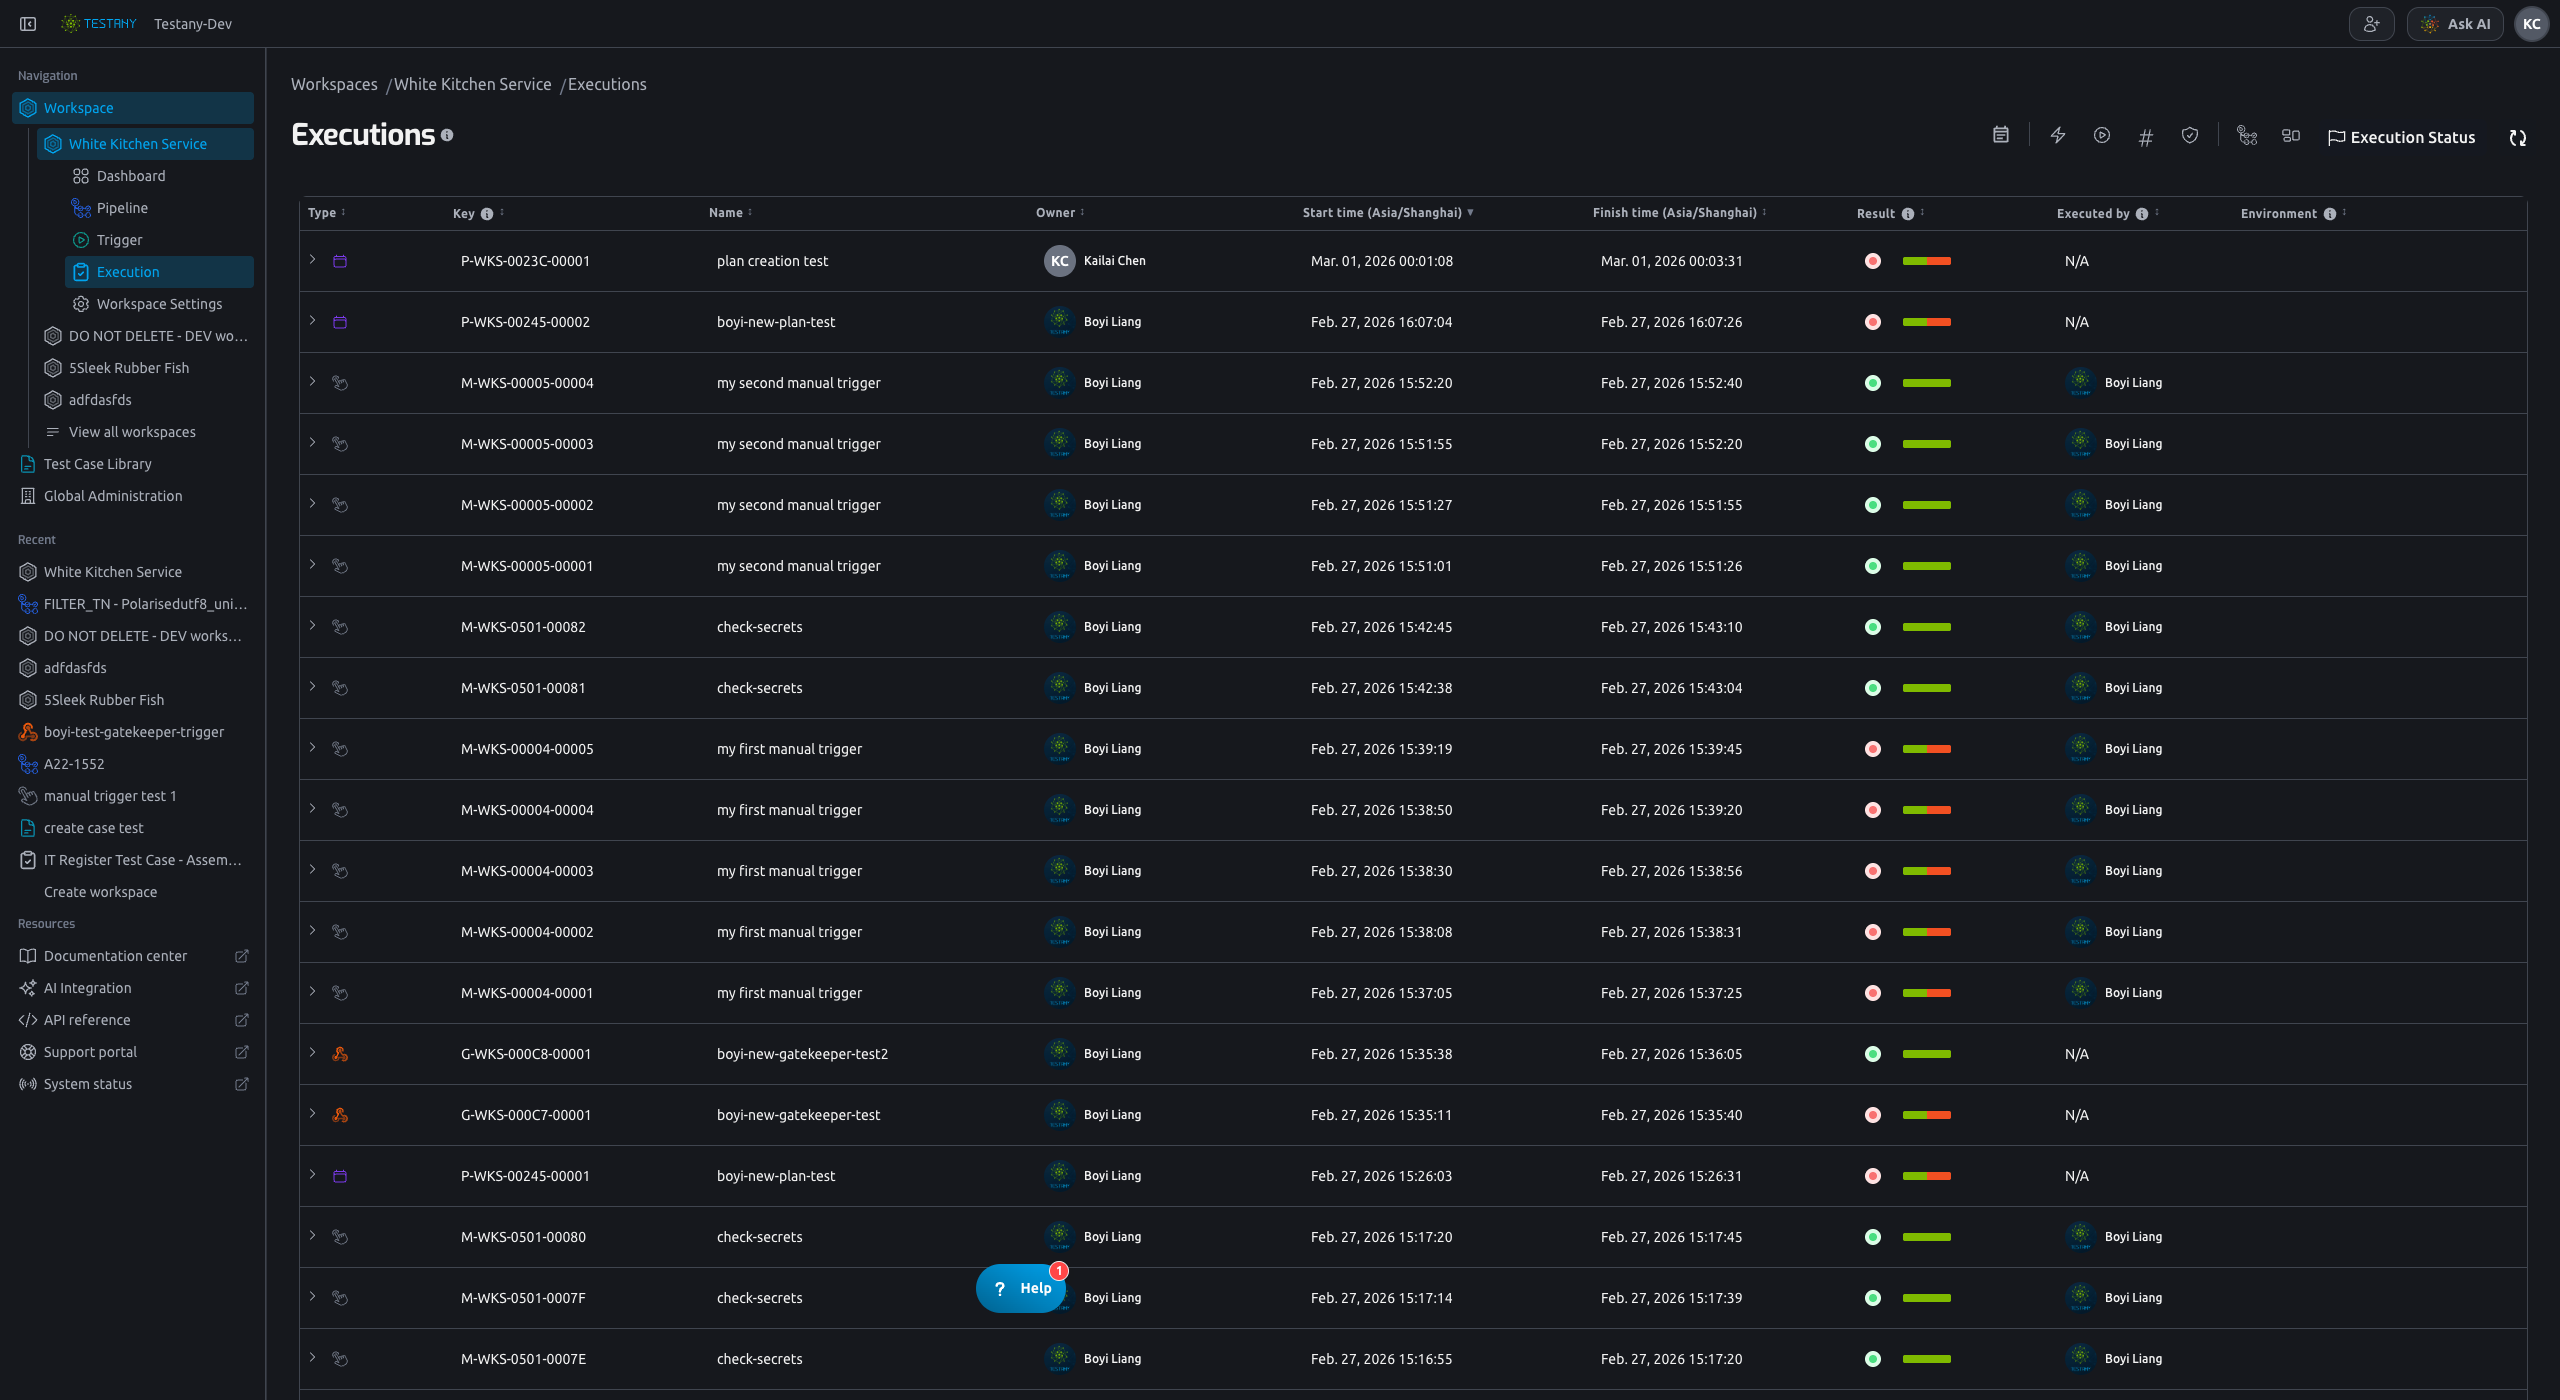
- Filters child rows by pipeline execution status.
- Parent rows are kept for context when matching child rows exist.
2. Understand top-level rows (trigger instance)
Each top-level row tells you:
- trigger type (manual / plan / gatekeeper)
- trigger id, trigger instance id, and trigger instance key
- object name (trigger object)
- owner
- start / finish time
- rolled-up result
- executor
3. Expand to pipeline-level rows
Expand a top-level row to see each pipeline execution in that trigger instance:
- pipeline execution key
- pipeline name
- environment
- per-pipeline result
When mixed results happen (some passed, some failed), this expansion is the fastest place to isolate the failing pipeline.
4. Open one pipeline execution detail
Click a pipeline execution key (for example WKS-0751-13850) to open the detail page.
Read the Execution Detail Page
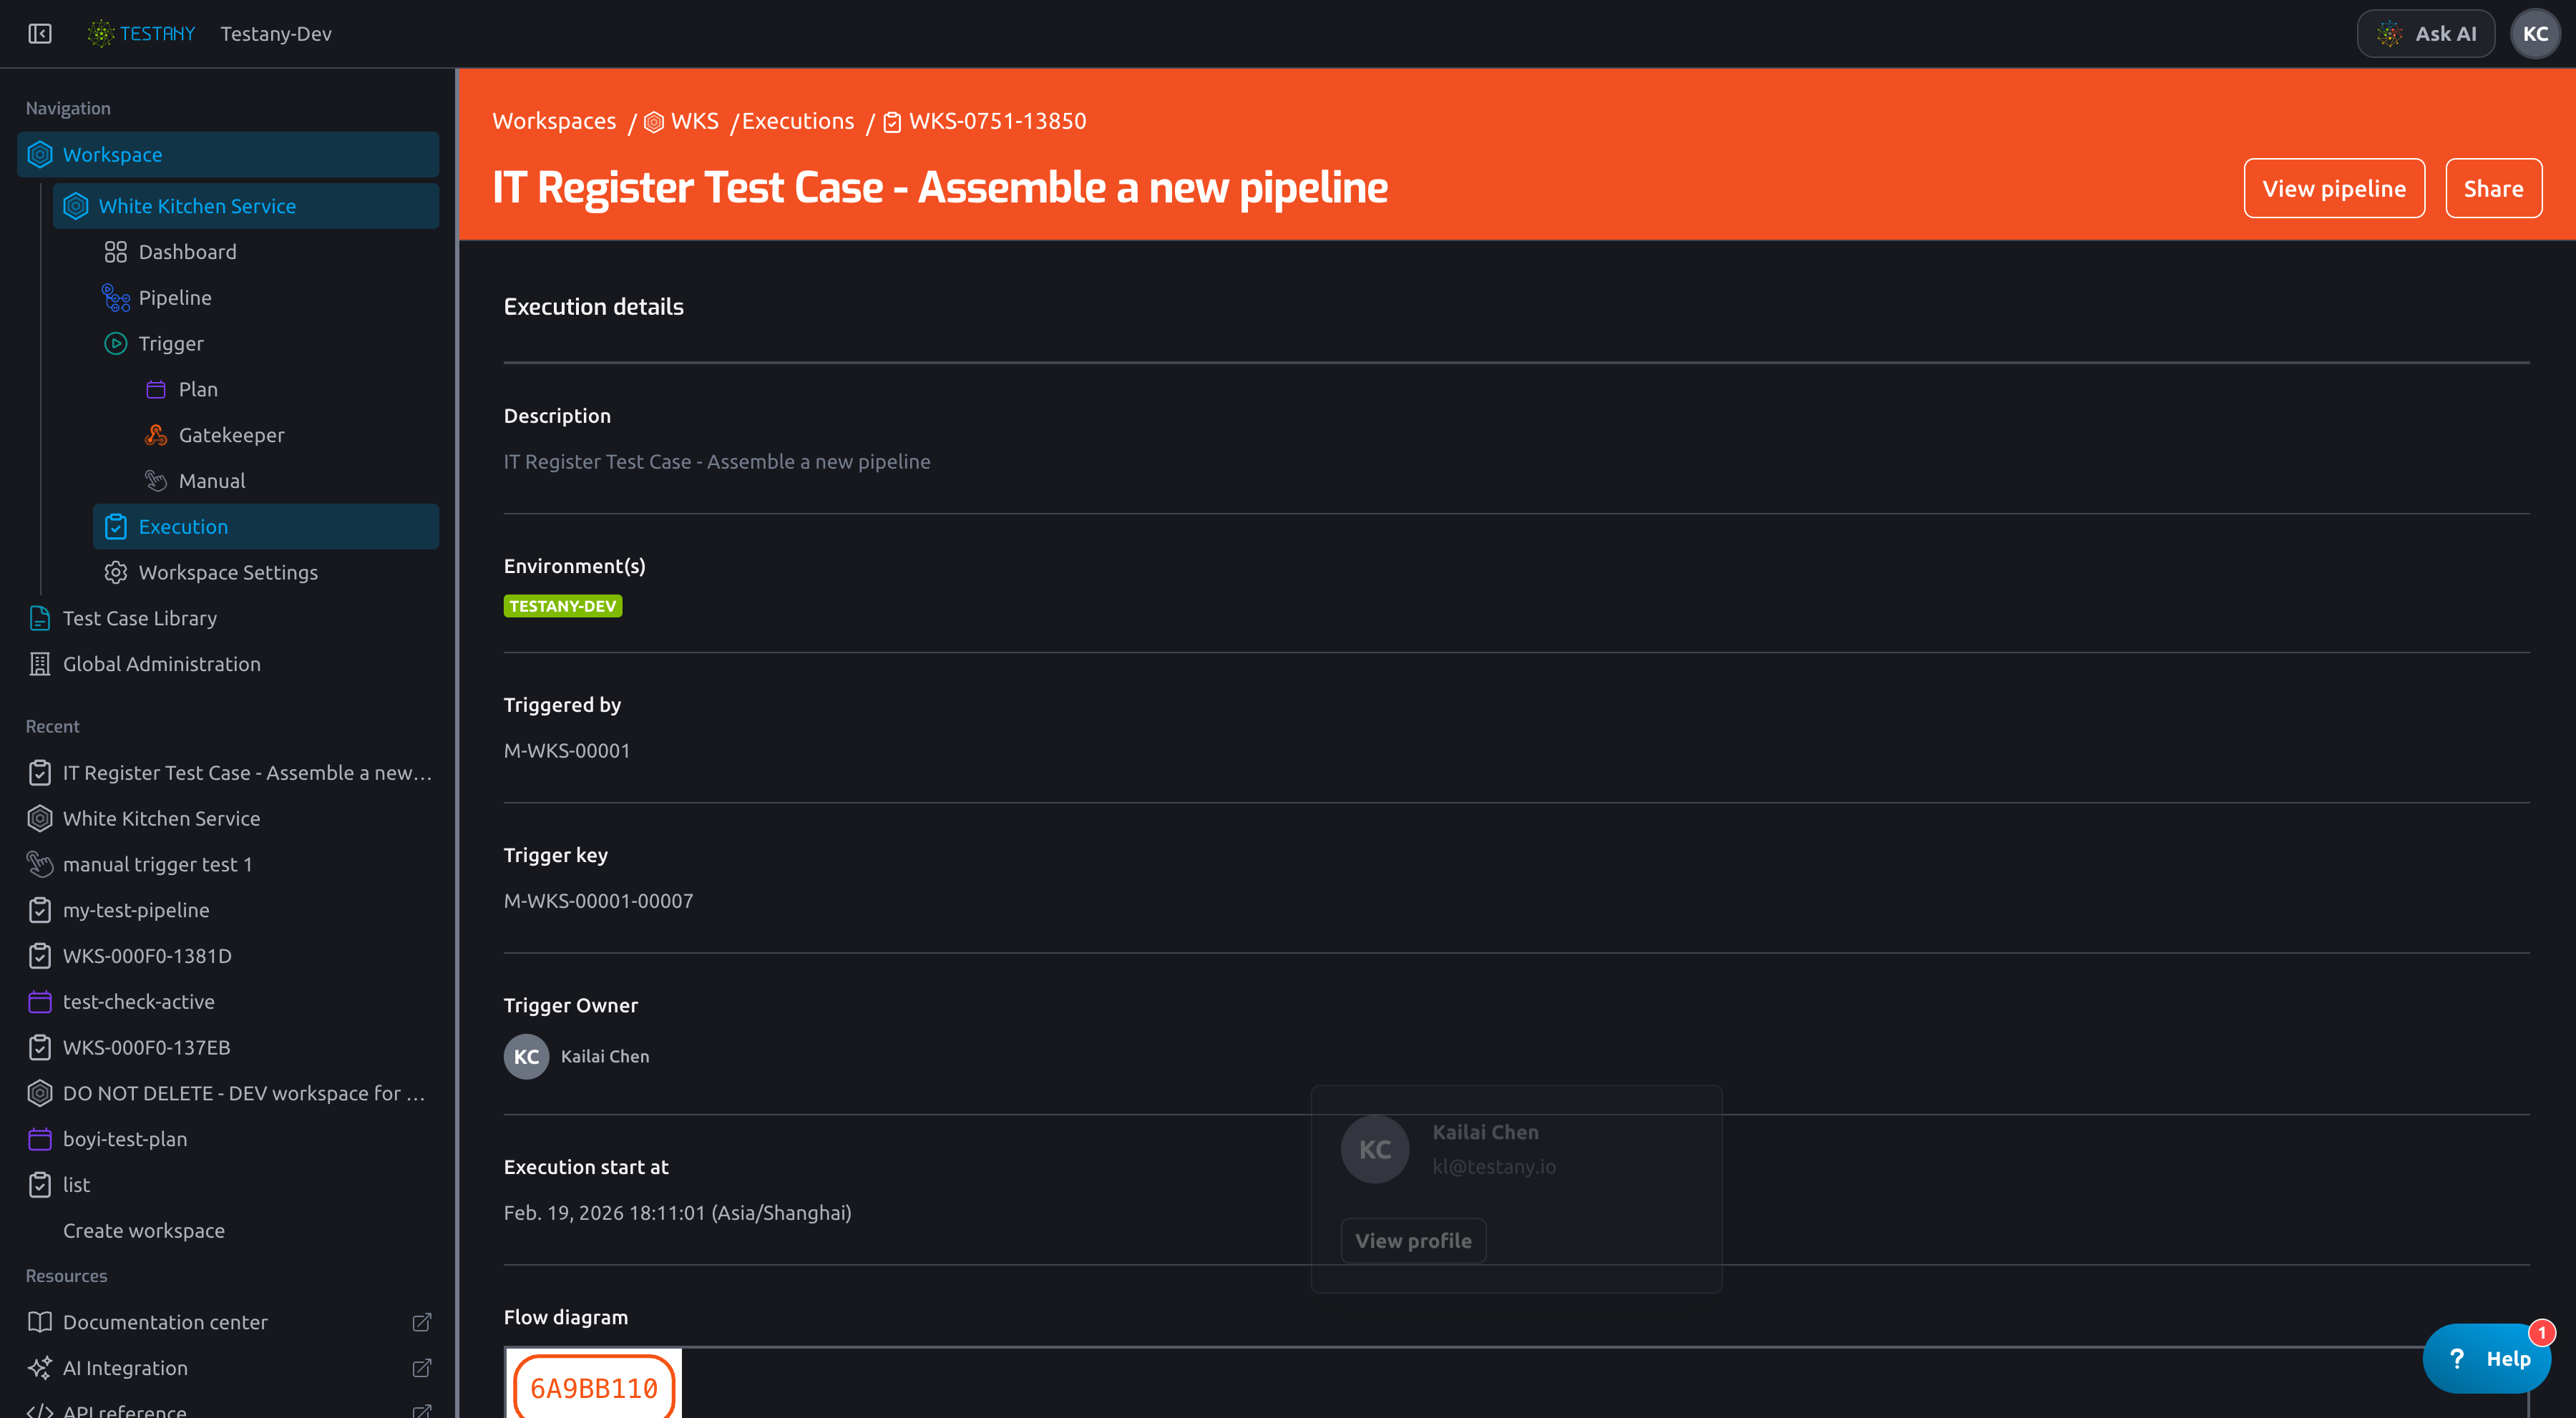
Execution Detail is the single source of truth for one pipeline run.
1. Header and context
Check these fields first:
- pipeline name and key
- environment
- trigger method
- trigger id / trigger instance id / trigger instance key
- trigger owner
- start time
This confirms whether you are looking at the right run context.
2. Flow graph and legend
Use the graph to identify where failure starts in the pipeline flow, especially in branch/conditional paths.
3. Test case execution table
Focus columns:
- test case key/name
- start time
- runtime
- environment
- status
- creator
This table gives the precise failing node(s).
4. Common Behaviors in Parallel Pipelines
If the pipeline uses rule/v1.3, you may see behaviors that differ from a legacy serial pipeline:
- Multiple test cases can enter
runningat nearly the same time. This is normal. - Not every semantically parallel-ready case starts at once. Default concurrency depends on instance type, for example Community Edition defaults to
2, paid Community users default to4, and Enterprise Edition defaults to8. - When more cases are ready in the same wave than the current workspace can start immediately, the platform refills execution as slots become available. When slots are limited, dispatch order follows YAML order.
- If the pipeline uses Output Relay, the test script that consumes relay data waits for the test script that provides relay data to finish cleanly before it starts.
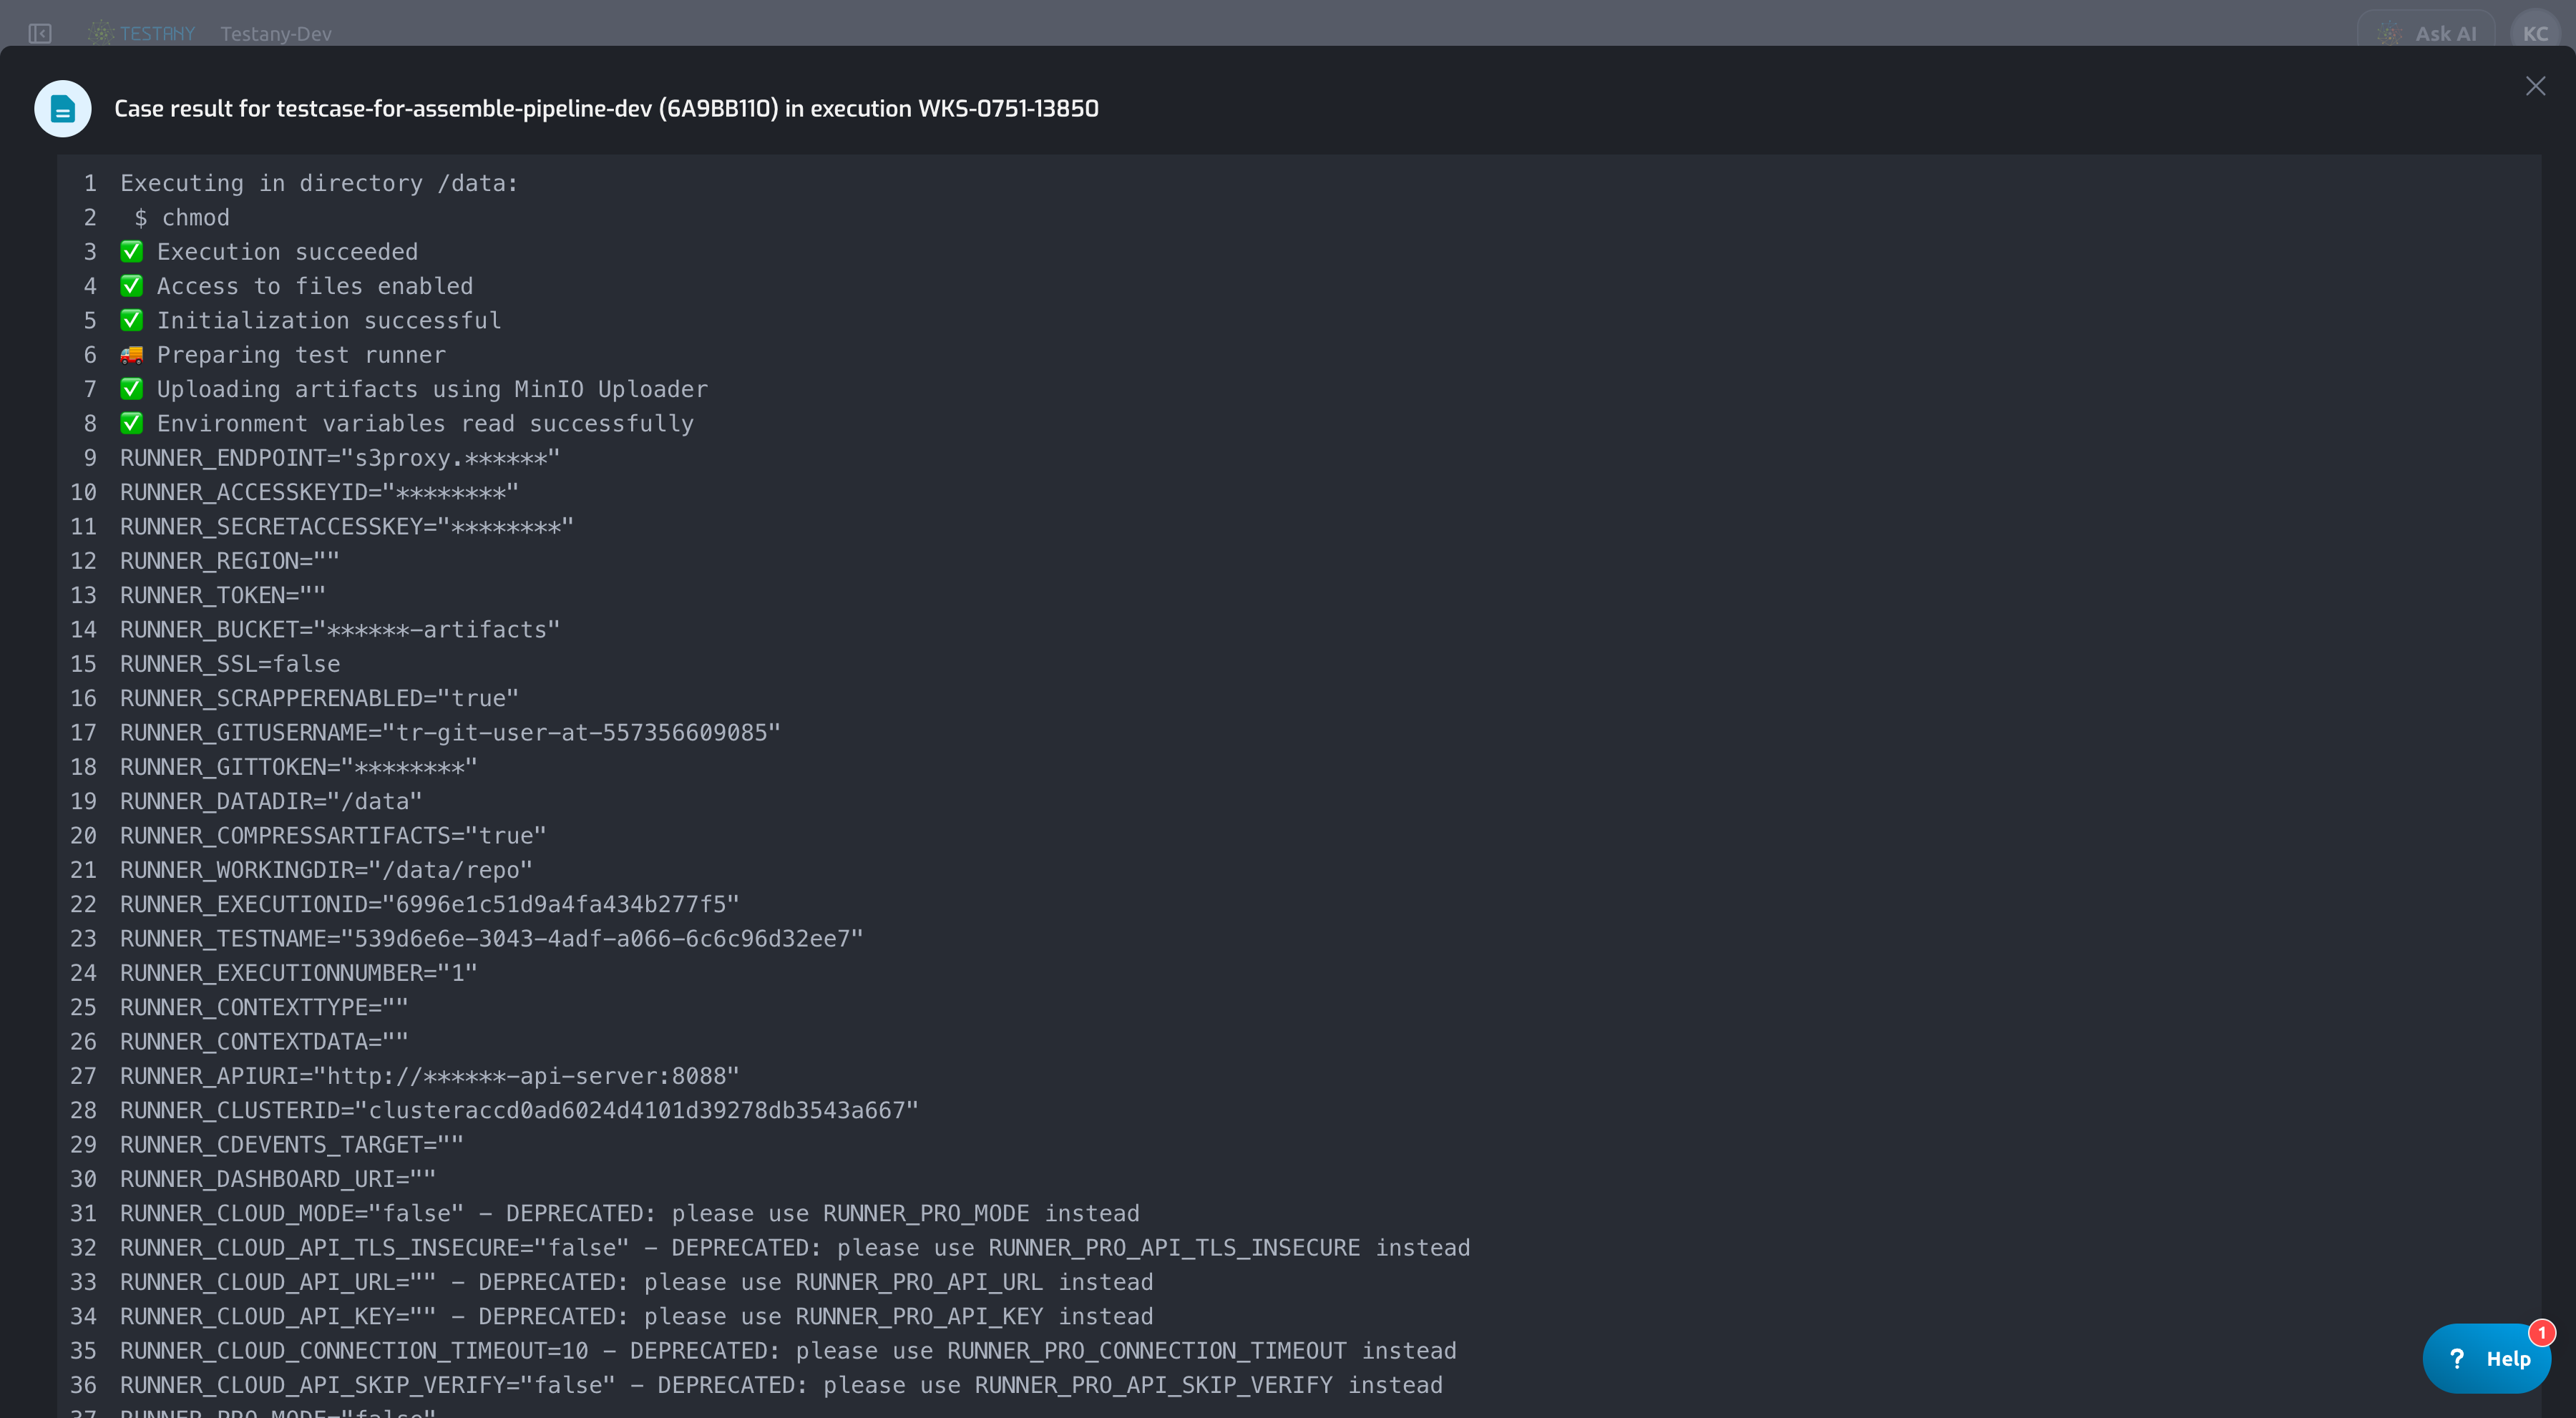
5. Open logs per test case
Click View Log on a failed row to inspect runtime output.
Practical Troubleshooting Path
Use this repeatable sequence:
- Find the problematic trigger instance in Execution List.
- Expand and identify which pipeline execution failed.
- Open Execution Detail for that pipeline execution.
- Locate failed test case row(s) and open logs.
- Correlate with status definitions in Understanding Statuses on Testany Platform.
Related Guides
Still have questions?
Our team is here to help. Get in touch and we'll get back to you as soon as possible.