
Manage Test Trigger Methods - Gatekeeper Trigger
Introduction to Gatekeeper
In the dynamic world of software development, efficiency and responsiveness are key. "Gatekeeper," a feature in our Testany platform, stands as a testament to this, offering users the ability to trigger specific groups of tests through webhooks.
Note: The voice in this video is AI-generated, not original.
Defining Gatekeeper and Its Key Components
Feature Overview
Gatekeeper empowers users to establish triggers for executing predefined pipeline groups when specific events occur, thereby enhancing ongoing product optimization and issue monitoring. This feature is not only beneficial for product teams aiming to improve release and deployment quality, but it is also invaluable for Operations teams. It allows for automatic testing of specific user journeys or features based on alert signals from monitoring platforms such as Splunk or Dynatrace. This capability significantly boosts troubleshooting efficiency during, and even before, the occurrence of incidents.
Understanding the Gatekeeper Key
Each Gatekeeper is assigned a unique identifier, the "Gatekeeper Key." The key format is G-{workspace_key}-{5 uppercase hex chars} (e.g. G-WKS-01AD1), representing the Gatekeeper and the corresponding workspace.
Webhook in Gatekeeper
Gatekeeper's functionality is enhanced by the integration of webhooks. These webhooks are essential for triggering the execution of test pipelines. Users can configure these webhooks to respond to various events, enabling the automated execution of tests in response to defined conditions. This integration is pivotal for maintaining an efficient and responsive testing environment, adapting quickly to changes and new data within the operational ecosystem.
Role of the Gatekeeper Owner
The Gatekeeper Owner plays a pivotal role, having authority to edit and manage Gatekeepers. They define the conditions under which tests are triggered and ensure the right team members are notified.
Setting Up a Gatekeeper
Creating a Gatekeeper involves a few straightforward steps:
-
Creating a Gatekeeper:
-
If you're a member of a workspace, you may see a new tab in the left-side bar named "Gatekeeper". Click it and you'll be redirected to the Gatekeeper section.

-
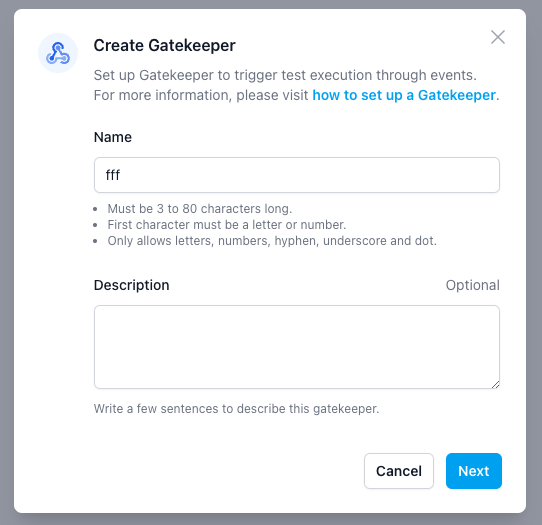
After you click the "Create Gatekeeper" button at the top-right corner, a create wizard will pop up:
-
After you put a name for the Gatekeeper as well as the description (optional), click next. You've already created a new Gatekeeper.
Configuring Webhooks and Test Pipelines:
-
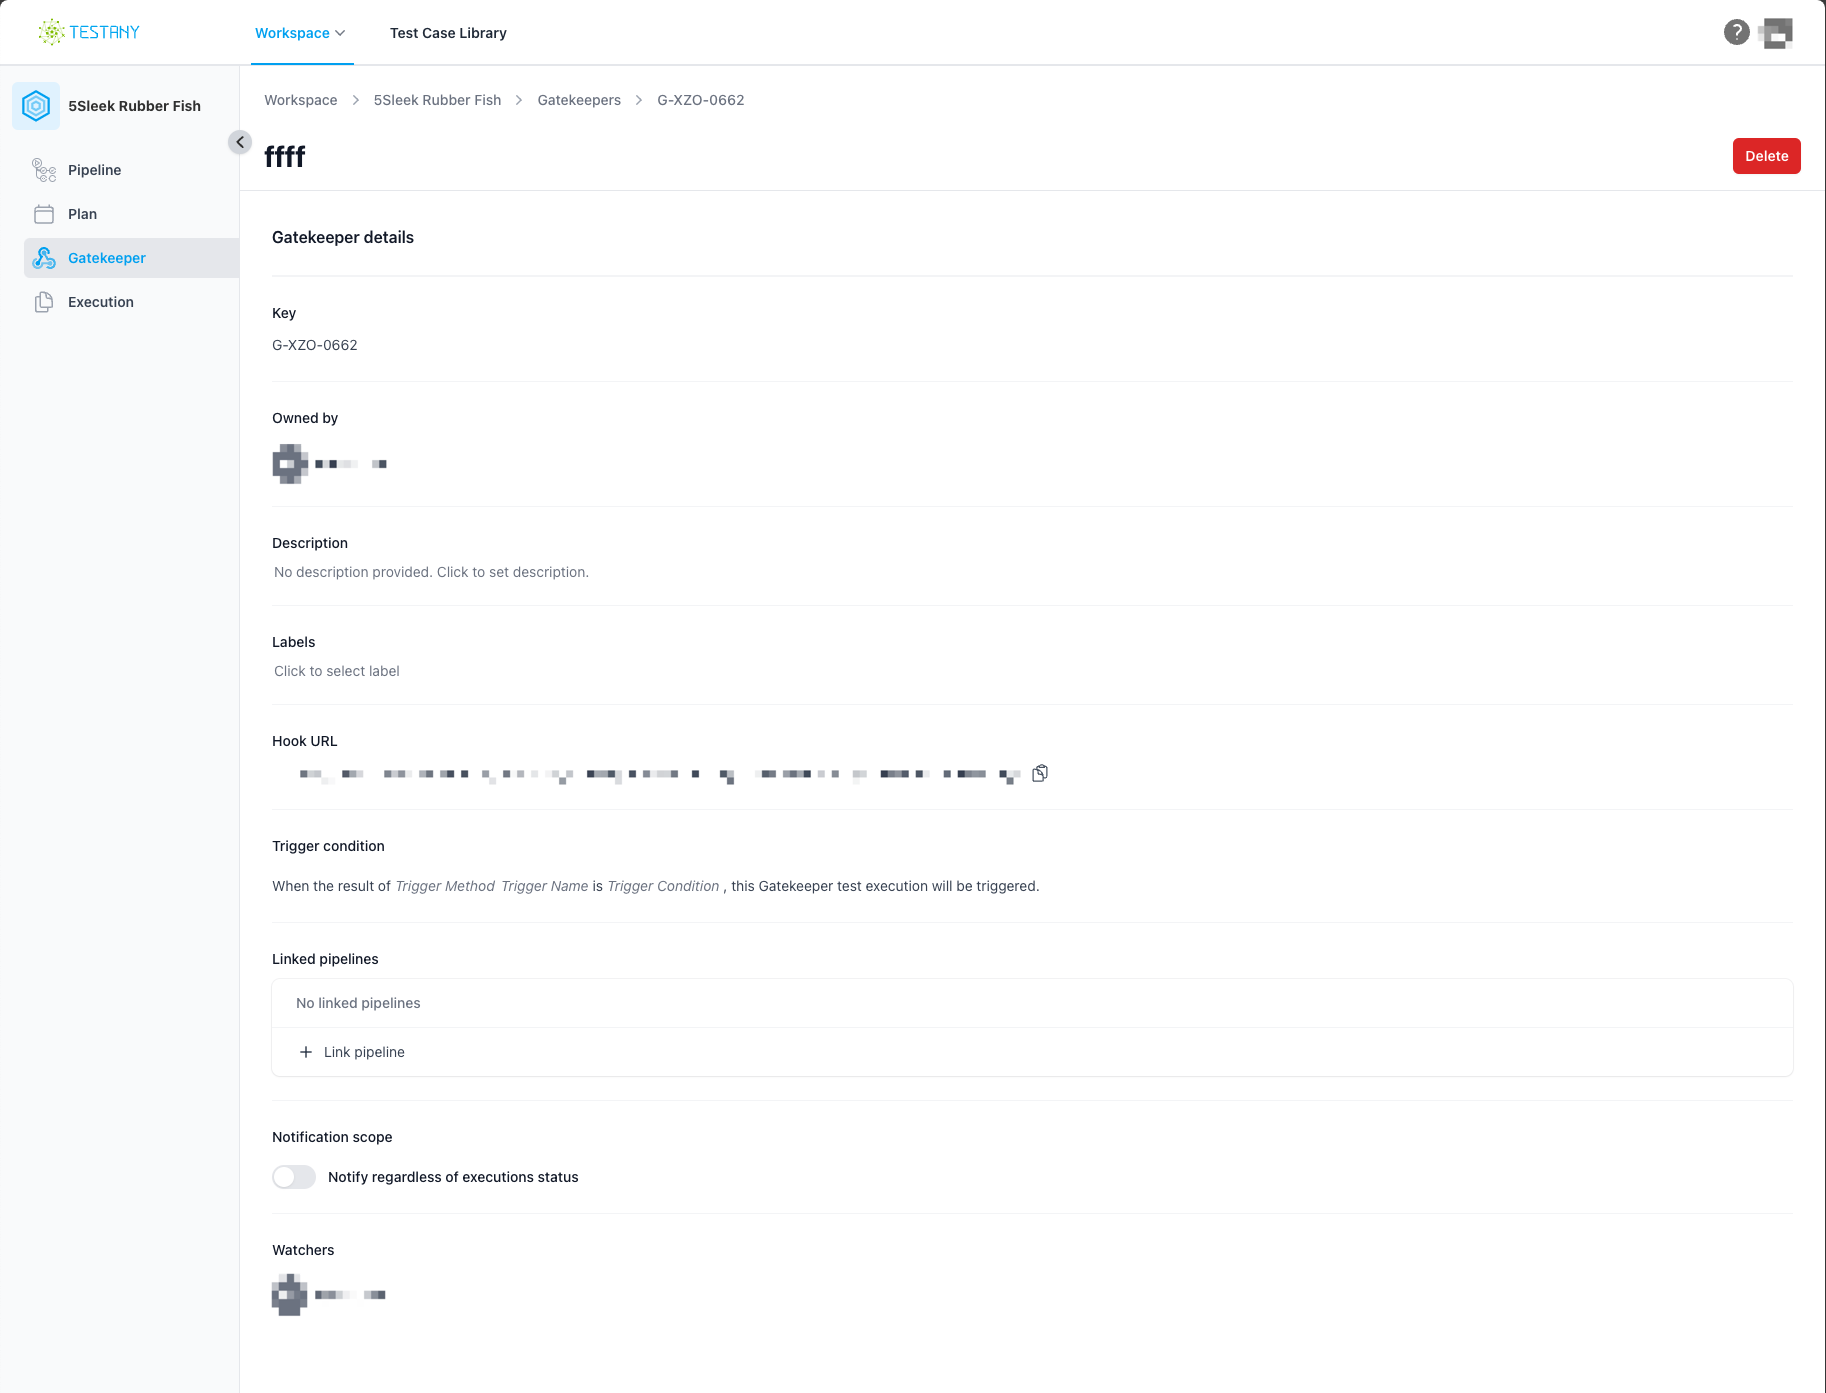
You can get into the Gatekeeper detail page to further edit the Gatekeeper.
-
The Gatekeeper detail page is an inline edit page. If you have the permission to edit it, you may follow "click-to-edit, save-on-blur" method to edit all fields in the page except Gatekeeper key. Please note:
Trigger Method,Trigger NameandTrigger Conditionfield in the Trigger Condition section is very important for you and other users to understand the Gatekeeper you setup, please fill it as precise as possible.
-
-
Defining Trigger Conditions: The Gatekeeper Owner sets the criteria for test execution.
Managing Gatekeepers
Gatekeepers can be easily managed by:
- Editing and Updating Gatekeepers: Make changes to configurations as needed.
- Adding Users to the Watcher List: Ensure relevant team members are kept in the loop.
- Transfer ownership to other workspace members: to make sure the Gatekeeper is well maintained.
Best Practices for Using Gatekeepers
The core value of Gatekeeper lies in: automatically triggering test executions on Testany when specific events occur in external systems via Webhooks. Here are five typical integration scenarios.
Scenario 1: CI/CD Pipeline Integration (Jenkins Example)
Use Case: Automatically trigger smoke tests or regression tests after code deployment to staging or production environments to ensure deployment quality.
Configuration Steps:
-
Create a Gatekeeper in Testany and obtain the Webhook URL (see "Setting Up a Gatekeeper" section above).
-
Add an HTTP request step in your Jenkins Pipeline script to call the Gatekeeper's Webhook URL.
Using the HTTP Request Plugin ↗:
Groovypipeline { agent any stages { stage('Deploy') { steps { // Your deployment steps sh 'deploy.sh' } } stage('Trigger Testany Tests') { steps { httpRequest( url: 'https://app.testany.com.cn/api/v2/gatekeeper/webhook/YOUR_GATEKEEPER_TOKEN', httpMode: 'POST', contentType: 'APPLICATION_JSON', requestBody: '{"source": "jenkins", "environment": "staging"}' ) } } } }Or using
curl:Groovystage('Trigger Testany Tests') { steps { sh ''' curl -X POST "https://app.testany.com.cn/api/v2/gatekeeper/webhook/YOUR_GATEKEEPER_TOKEN" \ -H "Content-Type: application/json" \ -d '{"source": "jenkins", "environment": "staging"}' ''' } }
Other CI/CD Platforms:
This approach works with any CI/CD platform—simply add an HTTP POST request to your pipeline:
- GitHub Actions: Use curl ↗ or HTTP Request Action ↗
- GitLab CI: Use
curlin your.gitlab-ci.yml - Azure DevOps: Use the InvokeRESTAPI task ↗
Scenario 2: Monitoring System Integration (Splunk Example)
Use Case: When your monitoring system detects anomalies (e.g., increased error rates, slower response times), automatically trigger diagnostic tests to help identify issues quickly.
Configuration Steps:
-
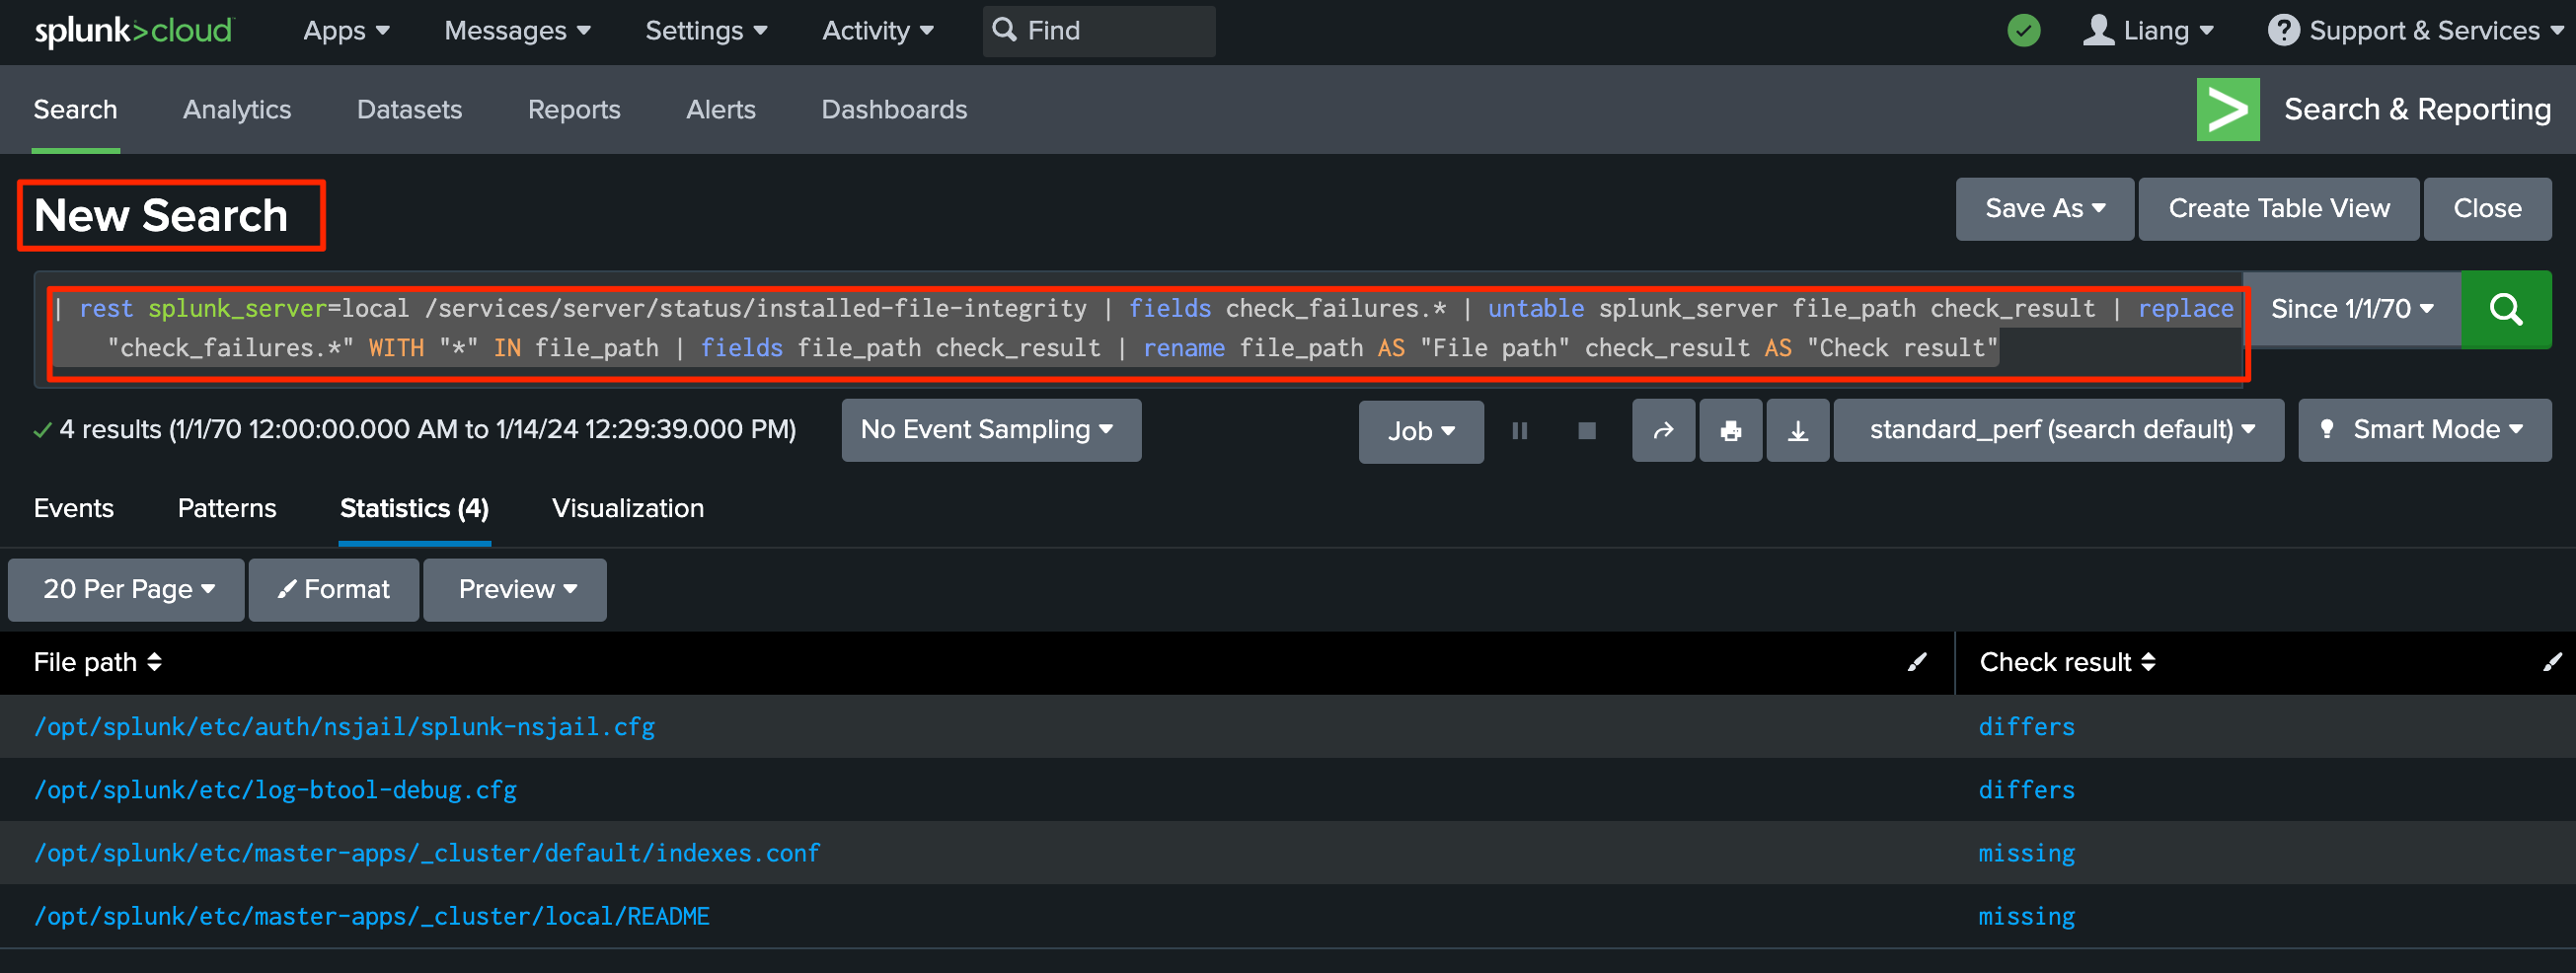
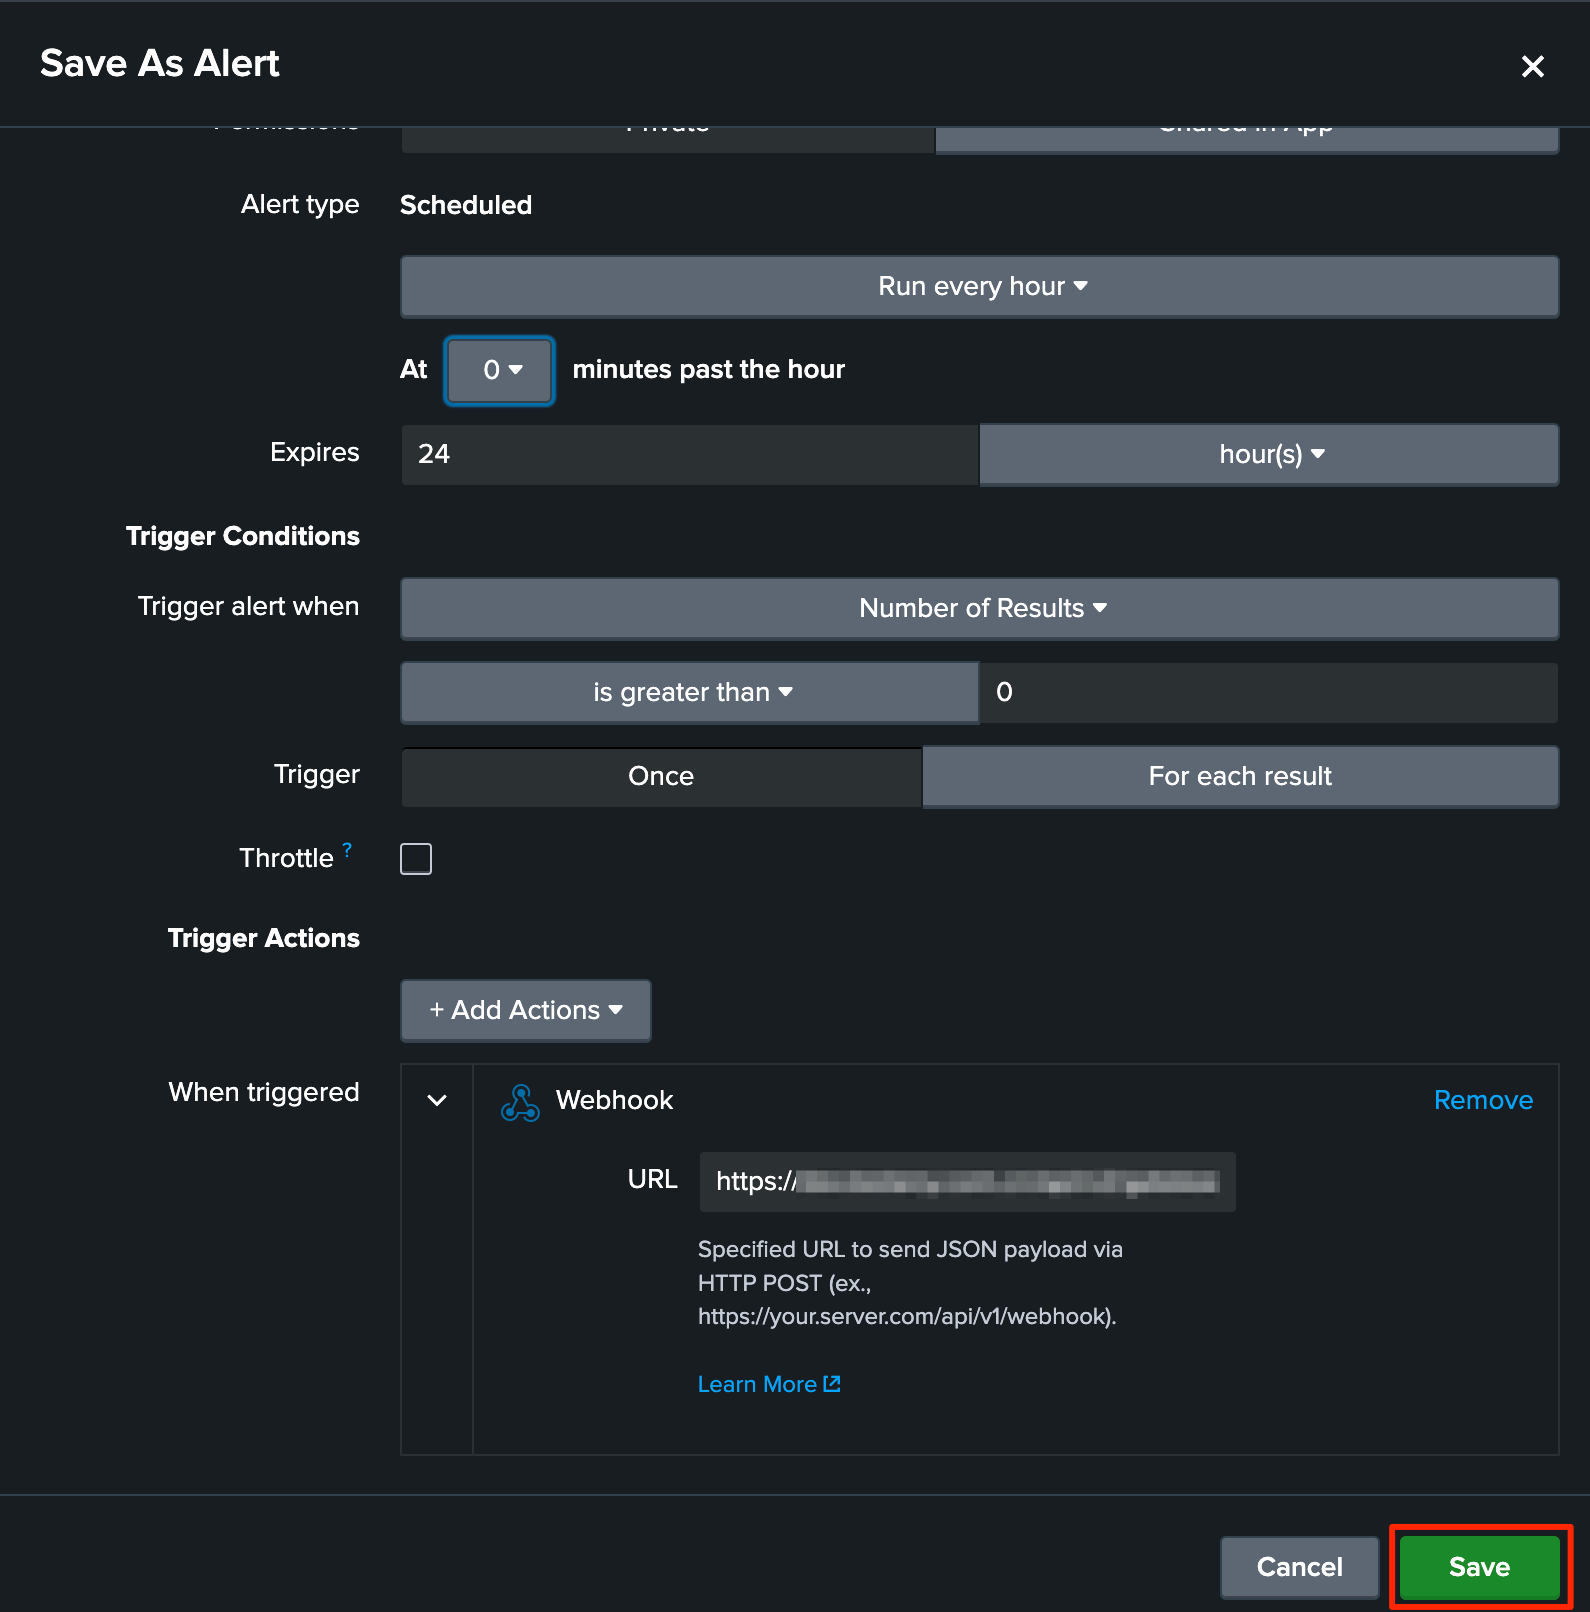
Log in to Splunk and create your business query.
-
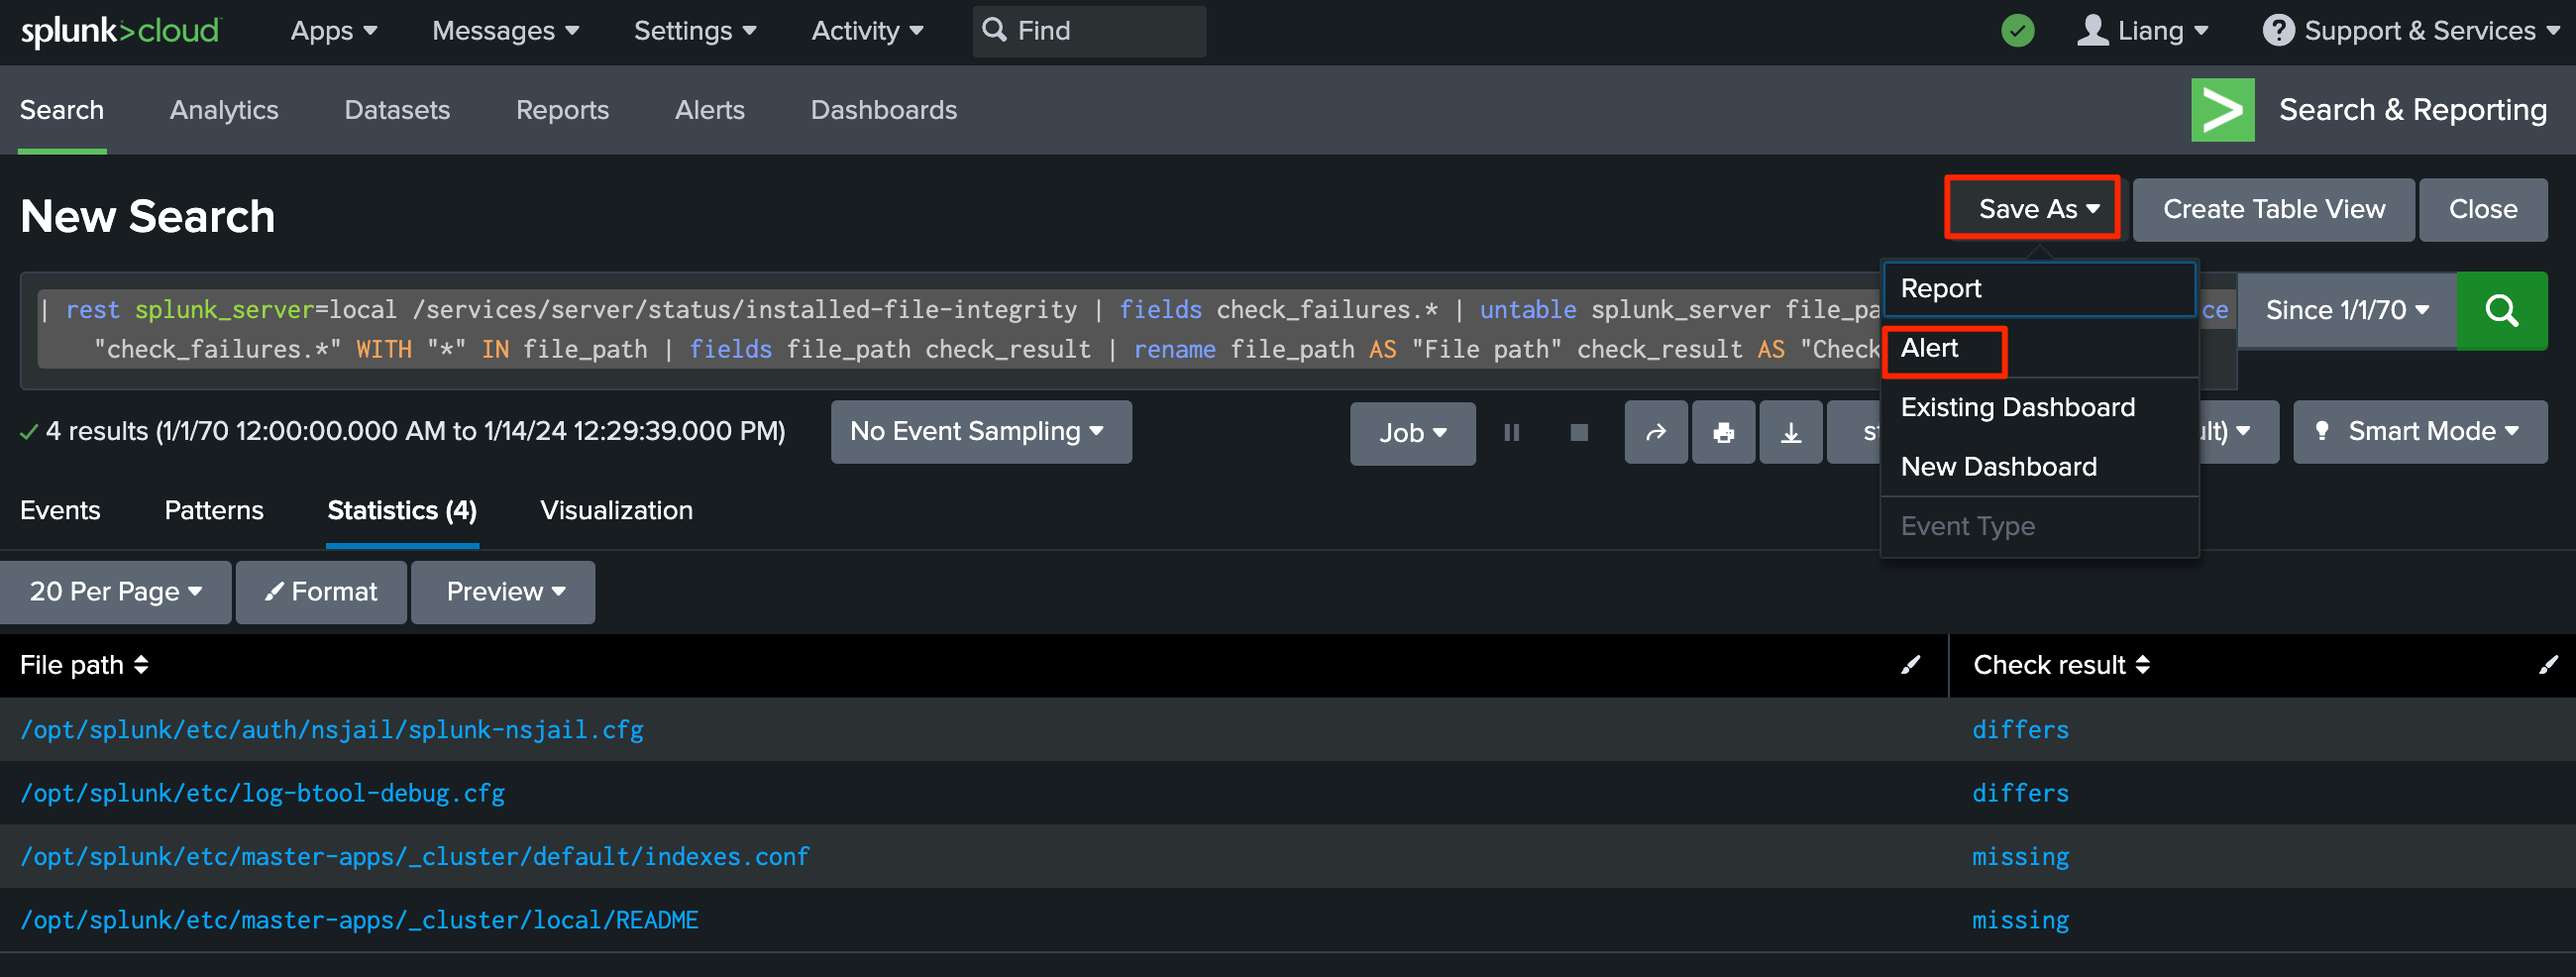
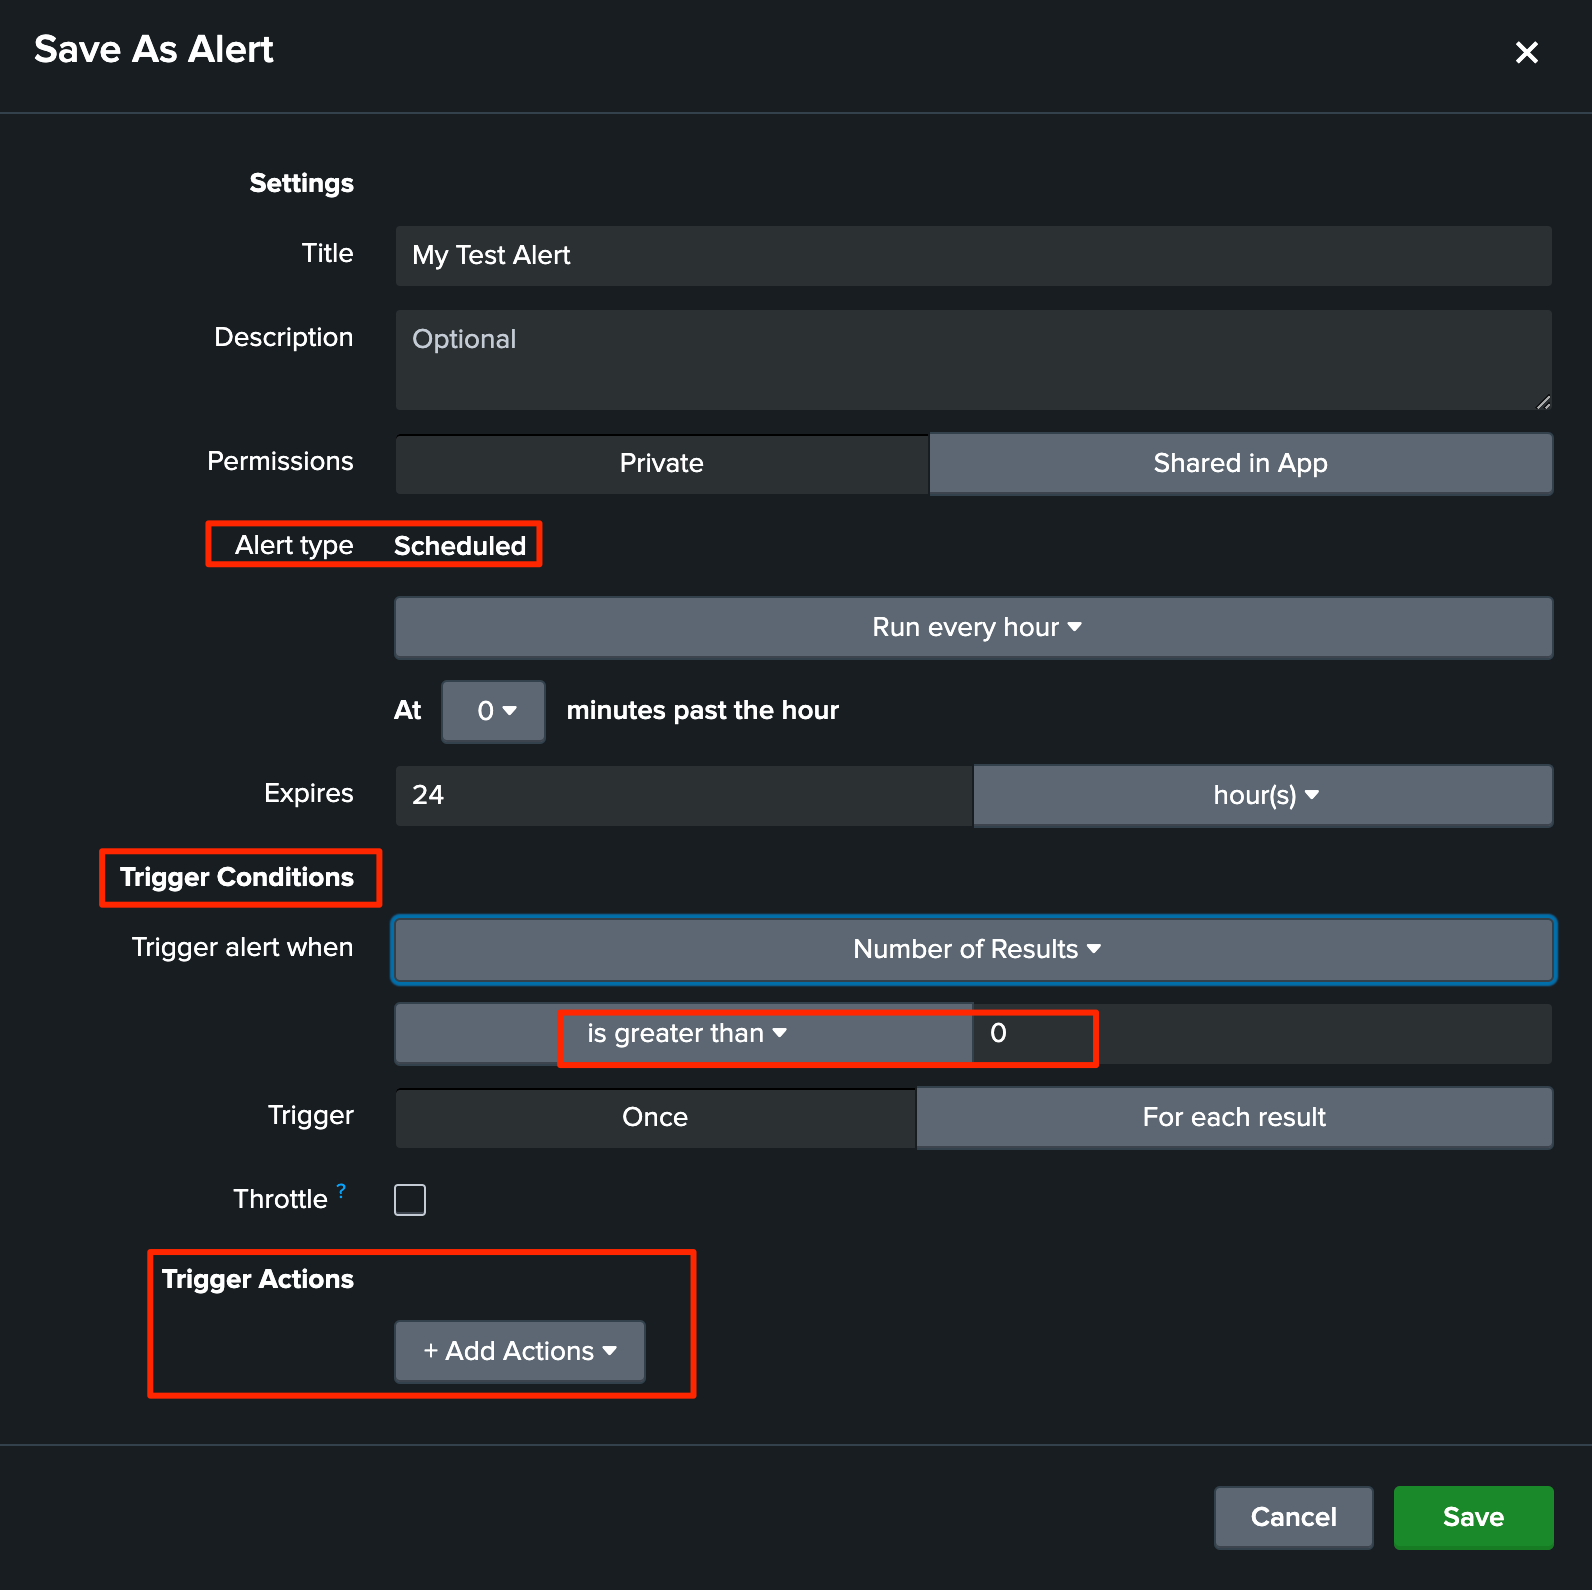
Save the search as an alert.
-
Configure alert conditions: Set the thresholds, time ranges, and severity levels for triggering the alert.
-
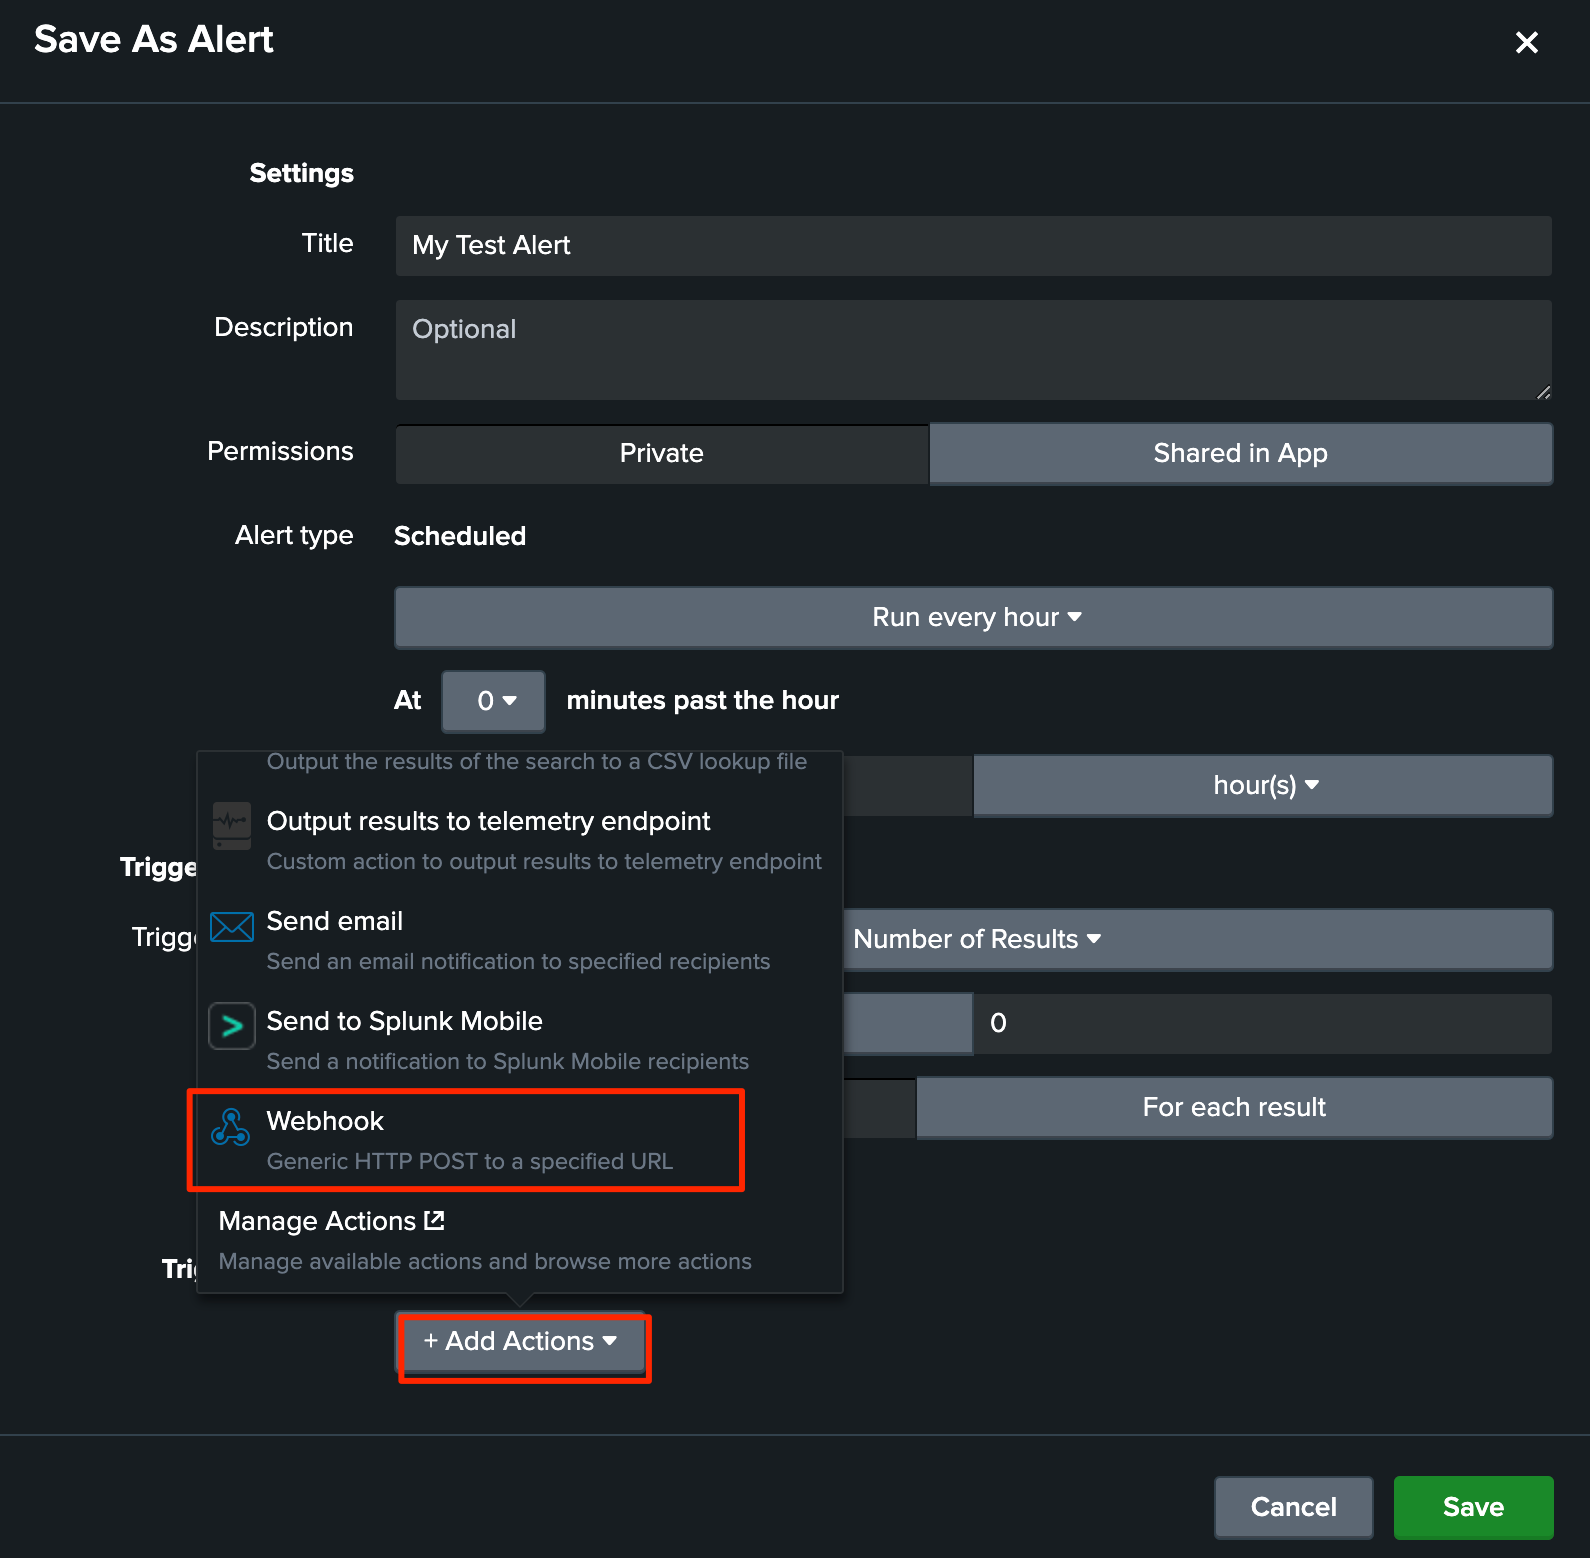
Set up the Webhook: Click "Add Actions" and select "Webhook".
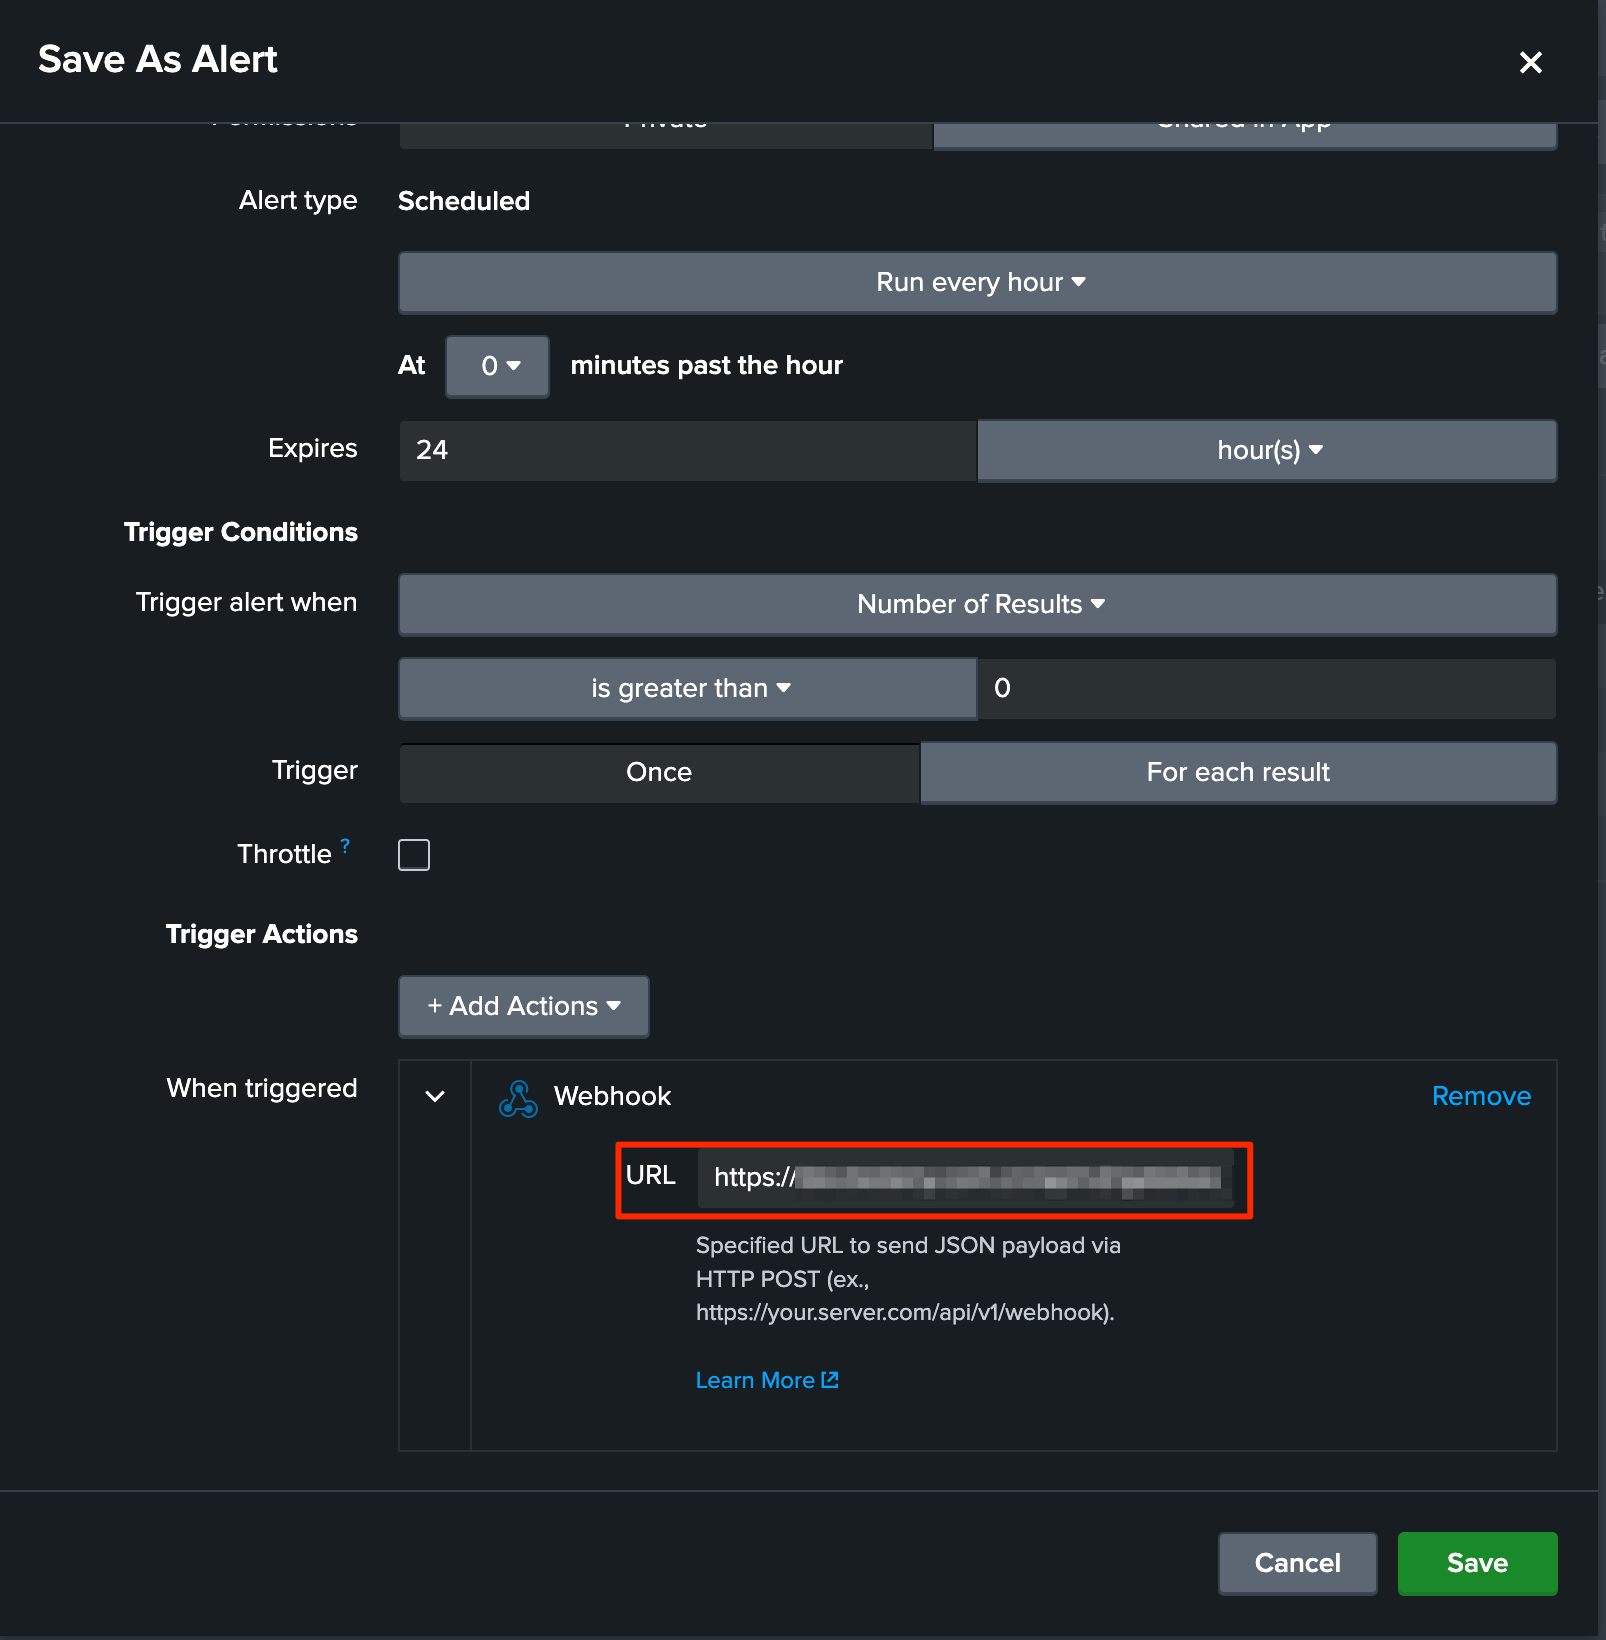
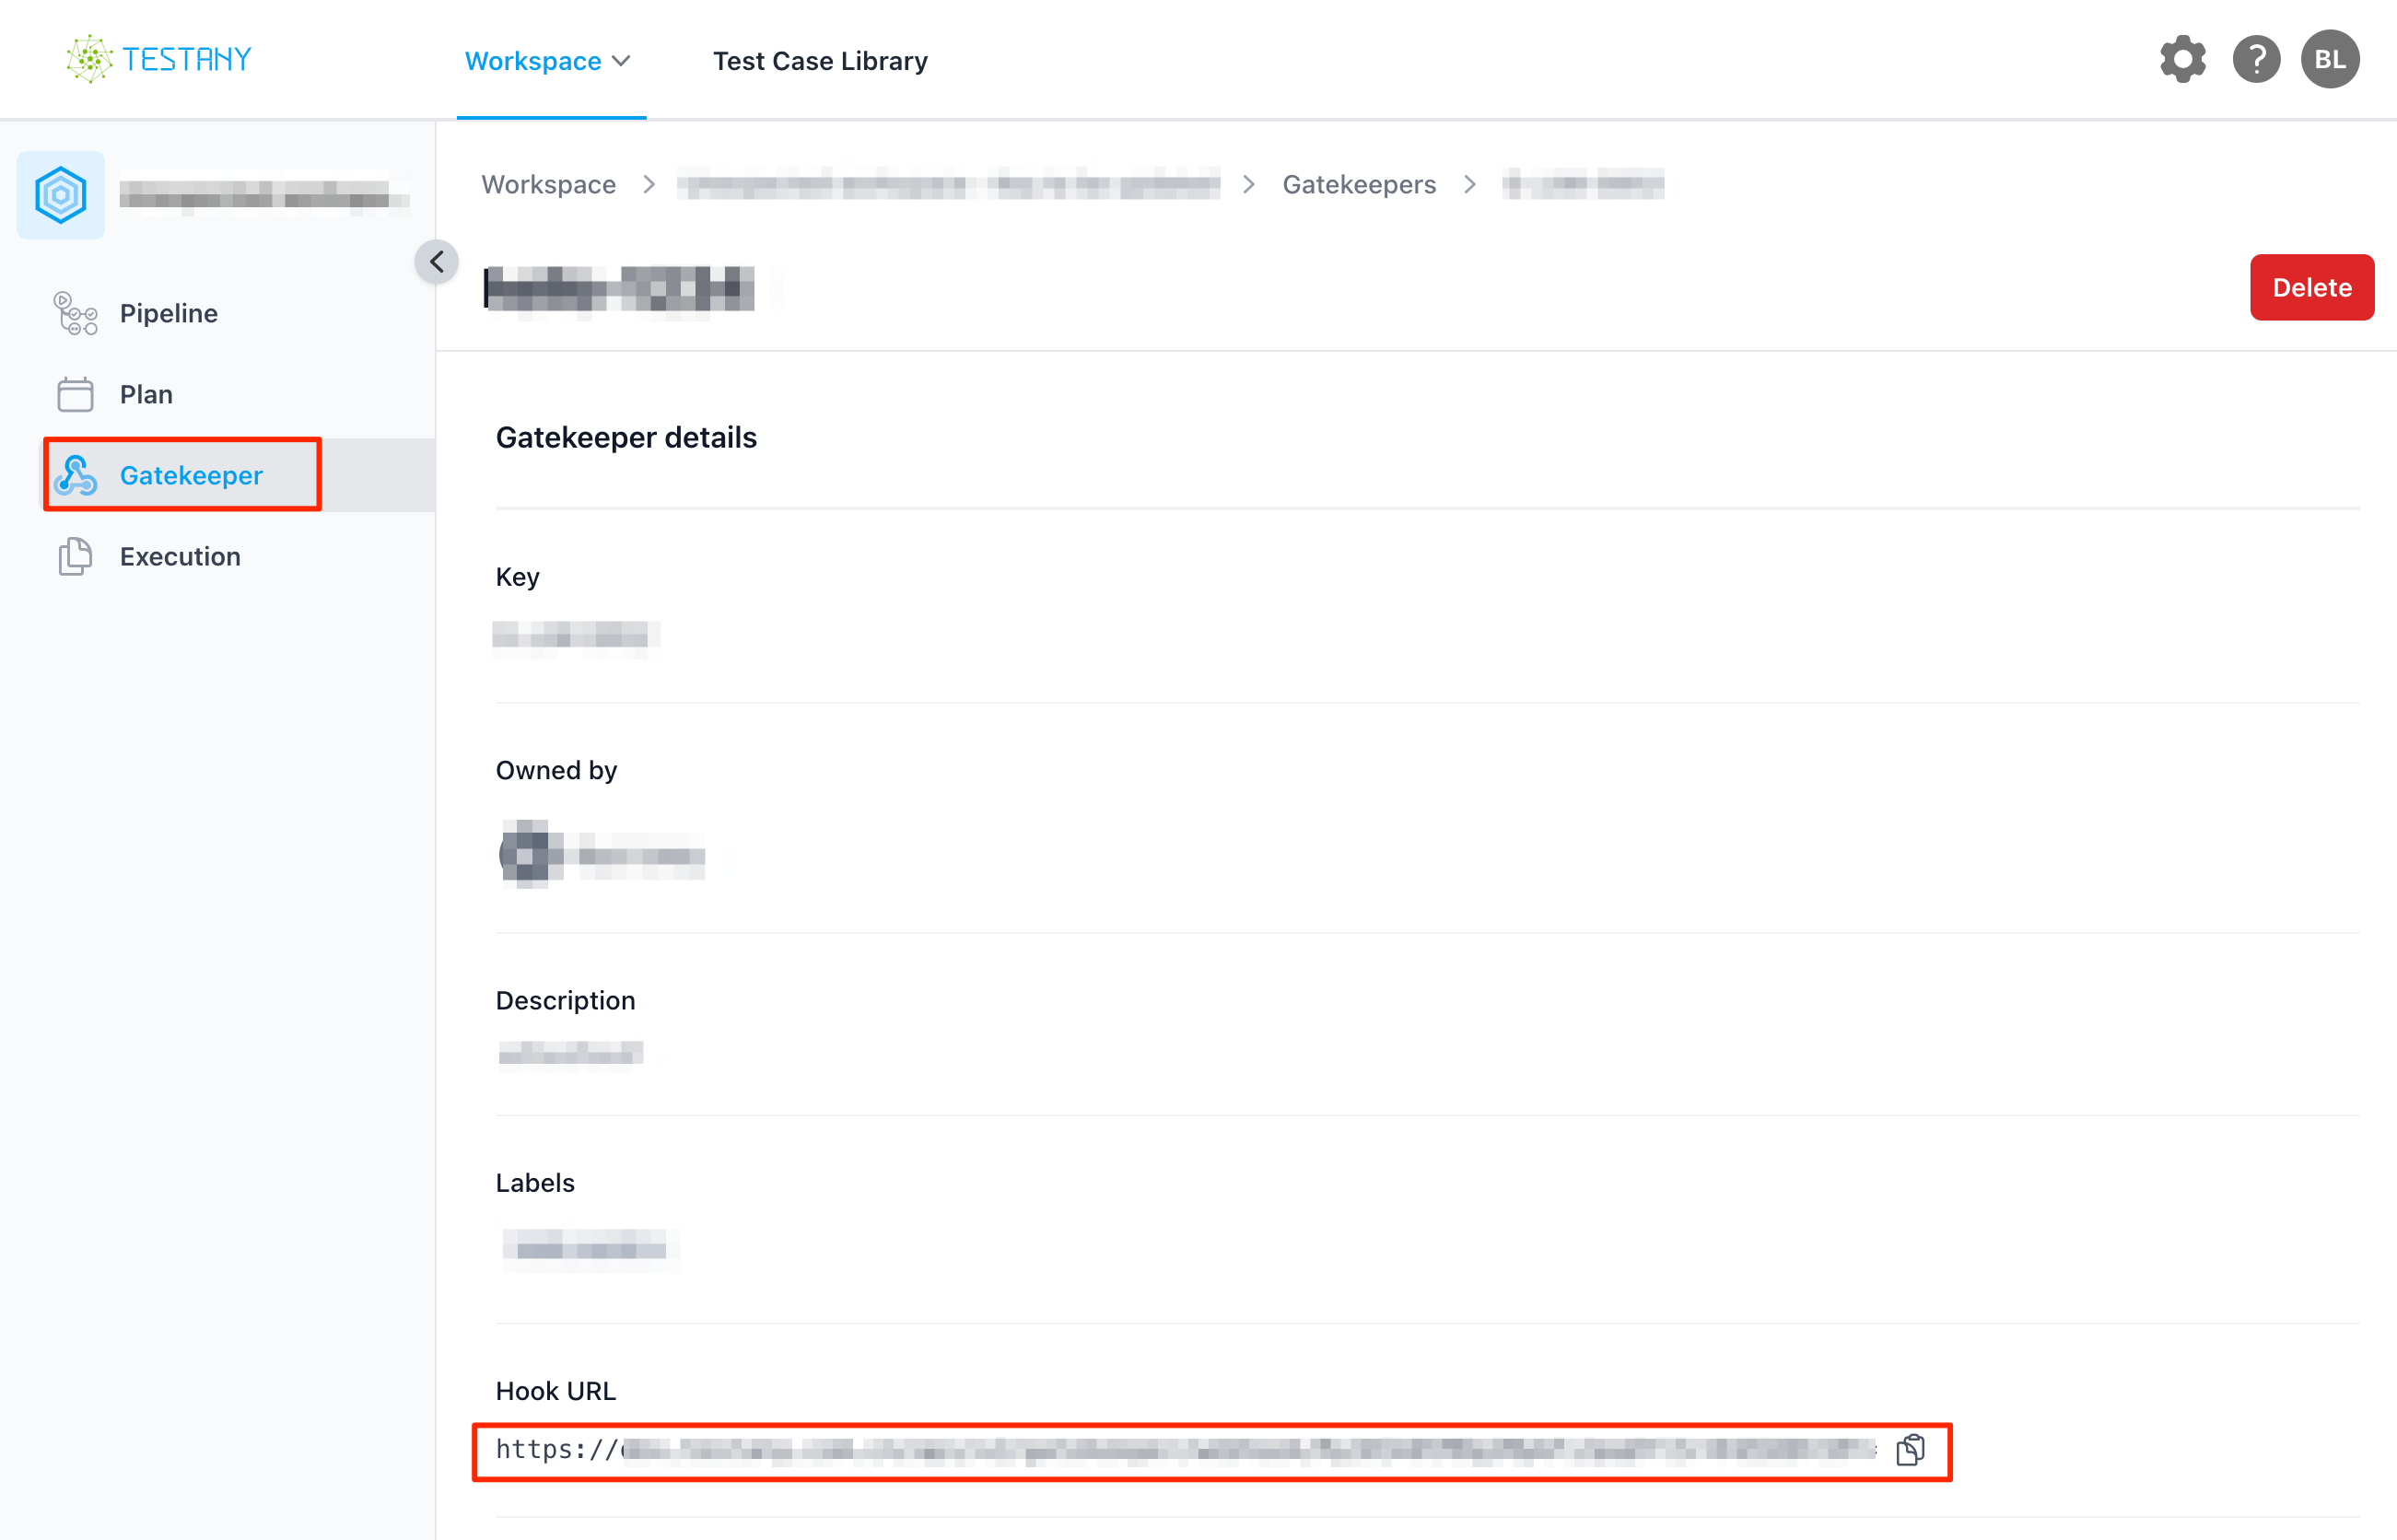
Paste the Webhook URL from your Testany Gatekeeper:
-
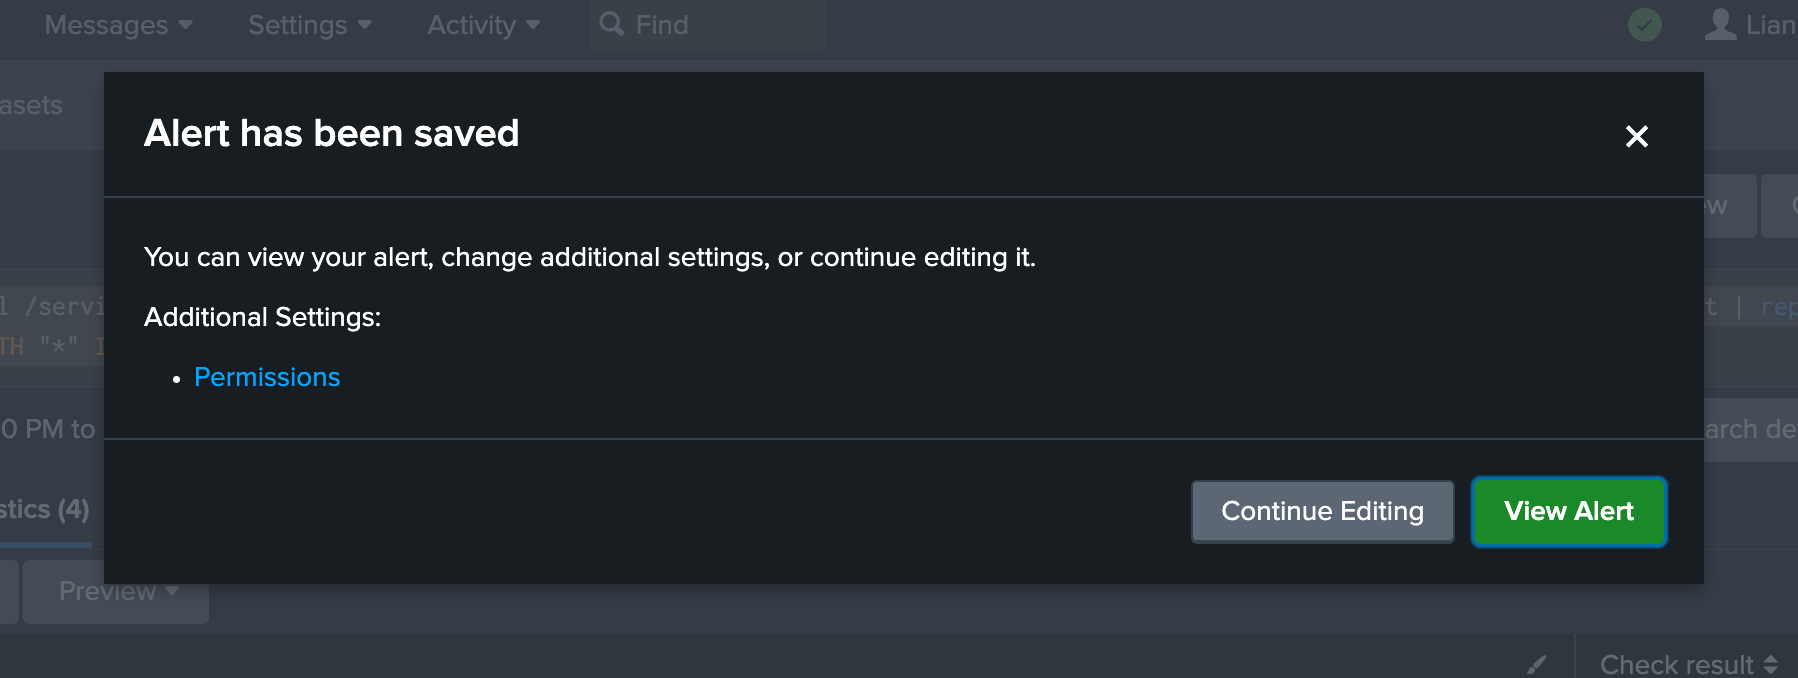
Save and enable the alert: Click "Save", then click "View Alert".
Other Monitoring Platforms:
- Datadog: See Webhooks Integration ↗
- Dynatrace: See Problem Notifications - Webhook ↗
- Prometheus + Alertmanager: See Webhook Config ↗
Scenario 3: Incident Management Integration (PagerDuty Example)
Use Case: When on-call engineers receive alerts, automatically run diagnostic tests to help identify the root cause and accelerate troubleshooting.
Configuration Steps:
-
Create a Gatekeeper in Testany and configure test pipelines for fault diagnosis.
-
Log in to PagerDuty ↗, go to Services → select the target service → Integrations tab.
-
Click Add an extension and select Generic V2 Webhook.
-
Configure the Webhook:
- Name: Enter an extension name, e.g., "Testany Gatekeeper"
- URL: Paste the Testany Gatekeeper Webhook URL
- Events: Select the event types to trigger (e.g.,
incident.triggered)
-
Click Save to save the configuration.
Once configured, when an alert is triggered for this service, PagerDuty will automatically call the Gatekeeper Webhook, triggering diagnostic tests on Testany.
For more details, see the PagerDuty Webhooks documentation ↗.
Other Incident Management Platforms:
- Opsgenie: See Webhook Integration ↗
- VictorOps (Splunk On-Call): See Outgoing Webhooks ↗
Scenario 4: ChatOps Integration (Slack Example)
Use Case: Allow team members to quickly trigger tests via Slack commands, lowering the barrier to use—no need to log into the Testany platform to initiate tests.
Configuration Steps:
-
Create a Gatekeeper in Testany and obtain the Webhook URL.
-
Create a Slack App:
- Visit Slack API ↗ and click Create New App
- Select From scratch, enter the App name, and select your workspace
-
Configure a Slash Command:
- In the App settings, go to Slash Commands → Create New Command
- Command: Enter the command name, e.g.,
/testany-smoke - Request URL: Paste the Testany Gatekeeper Webhook URL
- Short Description: Enter a description, e.g., "Trigger smoke tests"
-
Install the App to your workspace: Go to Install App and click Install to Workspace.
Once configured, team members can type /testany-smoke in Slack to trigger the corresponding test pipeline.
For more details, see the Slack Slash Commands documentation ↗.
Other ChatOps Platforms:
- Microsoft Teams: See Outgoing Webhooks ↗
- Lark (Feishu): See Custom Bot Messages ↗
Scenario 5: Third-Party Service Dependency Monitoring (Statuspage Example)
Use Case: When a third-party service you depend on (payment gateways, SMS services, cloud storage, etc.) experiences status changes, automatically trigger integration tests to verify the impact on your system.
Configuration Steps:
-
Create a Gatekeeper in Testany and configure integration test pipelines related to the third-party service.
-
Log in to Atlassian Statuspage ↗ (or the Statuspage of the service you depend on).
-
Go to Subscribers → Webhook Subscribers → Add Subscriber.
-
Configure the Webhook:
- Endpoint URL: Paste the Testany Gatekeeper Webhook URL
- Email: Enter a notification email (for webhook failure notifications)
- Components: Select the components to monitor
-
Click Save to save the configuration.
Once configured, when the third-party service status changes (e.g., from Operational to Degraded Performance), Statuspage will automatically call the Gatekeeper Webhook, triggering the relevant integration tests.
For more details, see the Statuspage Webhook Notifications documentation ↗.
Common Third-Party Service Statuspages:
Conclusion
Gatekeeper is a powerful tool in the Testany platform, offering streamlined and efficient test management. By understanding and utilizing its features effectively, teams can significantly enhance their testing processes and overall product quality.
×
Still have questions?
Our team is here to help. Get in touch and we'll get back to you as soon as possible.